#XAUUSD @ 1,996.76 Gold price extends week-start recovery from a short-term key support line, renews intraday high of late., @nehcap view: Limited upside expected (Pivot Orderbook analysis)
…
This is a premium post.
[s2If !current_user_can(access_s2member_level4)]Please register for FREE REGISTER to read full post below containing analysis. In case of any error or you think you are not able to read the full post below, please email us at support#nehcap.com [lwa][/s2If] [s2If current_user_can(access_s2member_level1)]
- Gold price extends week-start recovery from a short-term key support line, renews intraday high of late.
- United States Treasury bond yields, US Dollar decline amid debt ceiling drama.
- XAU/USD market also seems to brace for dovish Federal Reserve, downbeat US Gross Domestic Product (GDP).
- US CB Consumer Confidence can direct intraday moves, risk catalysts are the key.
The pair currently trades last at 1996.76.
The previous day high was 1990.91 while the previous day low was 1974.13. The daily 38.2% Fib levels comes at 1984.5, expected to provide support. Similarly, the daily 61.8% fib level is at 1980.54, expected to provide support.
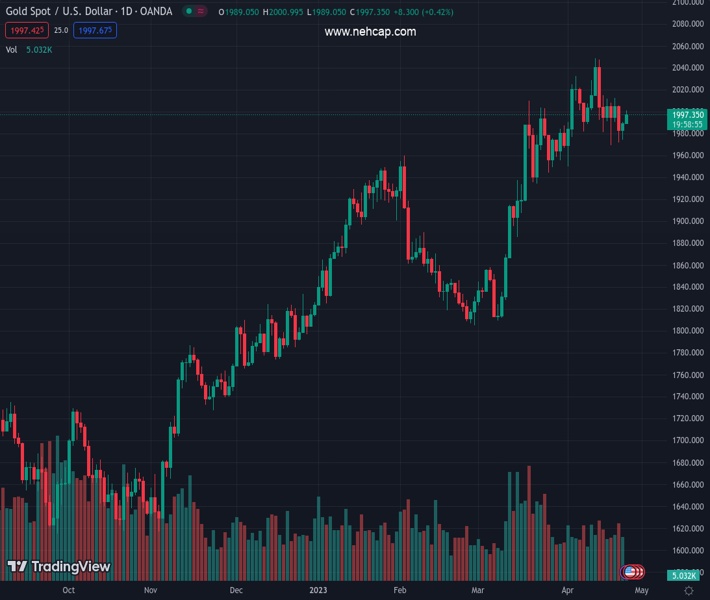
Gold price (XAU/USD) picks up bids to refresh intraday high near $1,996 as it stretches the previous day’s rebound from a five-week-old ascending support line during early Tuesday. In doing so, the bright metal cheers downbeat the United States Treasury bond yields and the US Dollar as markets prepare for the key US Gross Domestic Product and the Federal Reserve (Fed) outcomes. Also weighing on the US bond coupons and the greenback are concerns surrounding the US debt ceiling which is likely to expire in June.
Gold price marches amid fears that the United States is reaching its debt limit expiration in June. A political drama ahead of that keeps traders on their toes and pushes them towards the risk-safety, which in turn propelled the demand for one-month US Treasury bond yields. On the same line, are the clues that the US Federal Reserve (Fed) could announce one last rate hike, worth 0.25%, in May before signaling the policy pivot.
With this, the difference between one-month and three-month US Treasury bond yields widen the most since 2001. As a result, the US Dollar Index (DXY) remains depressed near 101.30 as it drops for the fourth consecutive day.
“The dollar fell to a more than one-week low against major currencies on Monday in generally thin trading, as investors continued to price in interest rate cuts this year by the Federal Reserve after a widely expected rate increase at next week’s policy meeting,” said Reuters in this regard.
Apart from the concerns surrounding the US debt ceiling and the Fed, recently softer US data also weigh on the US Dollar and allow the XAU/USD to remain firmer. That said, the Federal Reserve Bank of Chicago’s National Activity Index (CFNAI) remained unchanged at -0.19 versus the -0.02 expected. However, the publication added that the index’s three-month moving average, CFNAI-MA3, increased to +0.01 in March from –0.09 in February. On the other hand, Dallas Fed Manufacturing Business Index for the said month dropped to 23.4 for April versus -14.6 expected and -15.7 prior.
It’s worth noting, however, that the geopolitical fears surrounding Russia and China join the market’s cautious mood ahead of this week’s top-tier growth and inflation data to prod the Gold buyers. That said, hopes of gradual economic recovery and an upbeat earnings season allow the US Dollar buyers to stay hopeful. Furthermore, geopolitical fears surrounding Russia, due to China’s alleged support to Moscow in fighting with Ukraine, as well as amid the Western readiness to increase sanctions on the Oil-rich nation, prod the market’s cautious optimism and put a floor under the US Dollar price.
Looking forward, US Conference Board’s (CB) Consumer Confidence gauge for April, expected to remain steady near 104.1 versus 104.2 prior, will be important for the intraday directions of the DXY. However, major attention will be given to US Q1 GDP, US Core PCE Price Index and the yields for a clear guide.
Gold price pierces a one-week-old descending resistance line as it approaches the 50-bar Simple Moving Average (SMA) of around $2,003 amid bullish signals from the Moving Average Convergence and Divergence (MACD) indicator. Also favoring the XAU/USD buyers is the steady Relative Strength Index (RSI) line, placed at 14.
With this, the bullion appears well set for further upside and can well aim for the monthly high of around $2,049.
On the contrary, Gold sellers need validation from a five-week-old ascending support line, around $1,980 by the press time, to retake controls.
Following that, the 200-bar SMA level of around $1,966 and the late March low surrounding $1,935 may gain the XAU/USD bear’s attention.
It’s worth noting that the XAU/USD weakness past $1,935 can quickly drag the quote towards the 61.8% Fibonacci retracement of its March-April upside, near the $1,900 threshold.
Trend: Limited upside expected
Technical Levels: Supports and Resistances
XAUUSD currently trading at 1995.72 at the time of writing. Pair opened at 1989.12 and is trading with a change of 0.33% % .
| Overview | Overview.1 | |
|---|---|---|
| 0 | Today last price | 1995.72 |
| 1 | Today Daily Change | 6.60 |
| 2 | Today Daily Change % | 0.33% |
| 3 | Today daily open | 1989.12 |
The pair remains strongly bullish on the daily timeframe. It trades above its 20 SMA @ 1995.25, 50 SMA 1922.41, 100 SMA @ 1889.02 and 200 SMA @ 1801.78.
| Trends | Trends.1 | |
|---|---|---|
| 0 | Daily SMA20 | 1995.25 |
| 1 | Daily SMA50 | 1922.41 |
| 2 | Daily SMA100 | 1889.02 |
| 3 | Daily SMA200 | 1801.78 |
The previous day high was 1990.91 while the previous day low was 1974.13. The daily 38.2% Fib levels comes at 1984.5, expected to provide support. Similarly, the daily 61.8% fib level is at 1980.54, expected to provide support.
Note the levels of interest below:
- Pivot support is noted at 1978.53, 1967.94, 1961.75
- Pivot resistance is noted at 1995.31, 2001.5, 2012.09
| Levels | Levels.1 |
|---|---|
| Previous Daily High | 1990.91 |
| Previous Daily Low | 1974.13 |
| Previous Weekly High | 2015.13 |
| Previous Weekly Low | 1969.26 |
| Previous Monthly High | 2009.88 |
| Previous Monthly Low | 1809.46 |
| Daily Fibonacci 38.2% | 1984.50 |
| Daily Fibonacci 61.8% | 1980.54 |
| Daily Pivot Point S1 | 1978.53 |
| Daily Pivot Point S2 | 1967.94 |
| Daily Pivot Point S3 | 1961.75 |
| Daily Pivot Point R1 | 1995.31 |
| Daily Pivot Point R2 | 2001.50 |
| Daily Pivot Point R3 | 2012.09 |
[/s2If]
Nehcap EA FIX downloadThe NEHCAP EA is high quality professional trading system geared to generate returns without using GRID or martingales.Each trade has strict risk per trade parameter. The pairs under management include EURUSD, GBPUSD, AUDCAD, AUDNZD,GBPAUD, EURAUD, EURCAD, CHFJPY and many more.The system is trading live: LIVE ACCOUNT TRACKING Apply for a free trial and track our account. Buy the system or use profit share mechanism to generate returns on your MT4.
Join Our Telegram Group
")


