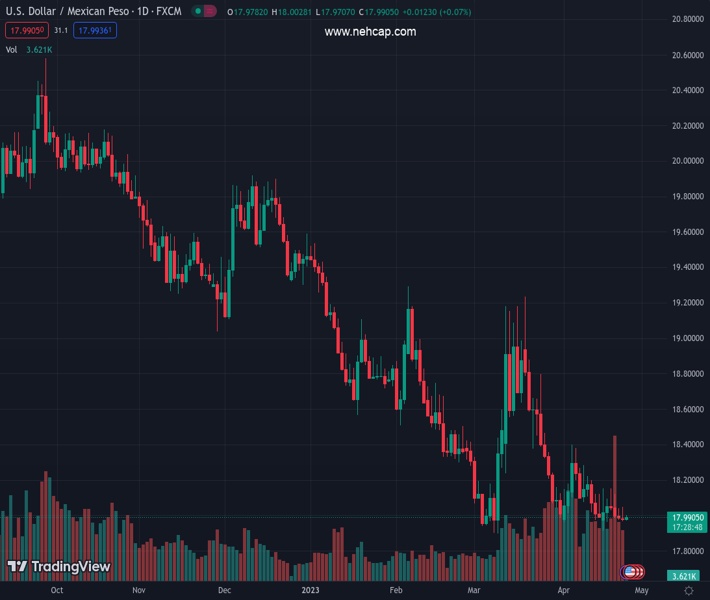
#USDMXN @ 17.9907 has managed to recapture the critical resistance of 18.00 amid a recovery in the US Dollar. (Pivot Orderbook analysis)
…
This is a premium post.
[s2If !current_user_can(access_s2member_level4)]Please register for FREE REGISTER to read full post below containing analysis. In case of any error or you think you are not able to read the full post below, please email us at support#nehcap.com [lwa][/s2If] [s2If current_user_can(access_s2member_level1)]
- USD/MXN has managed to recapture the critical resistance of 18.00 amid a recovery in the US Dollar.
- S&P500 futures have extended their losses as investors are cautious ahead of quarterly results from giant technology stocks.
- USD/MXN
- is auctioning in a Descending Triangle chart pattern, which indicates a volatility contraction.
The pair currently trades last at 17.9907.
The previous day high was 18.0479 while the previous day low was 17.966. The daily 38.2% Fib levels comes at 17.9973, expected to provide resistance. Similarly, the daily 61.8% fib level is at 18.0166, expected to provide resistance.
The USD/MXN pair has extended its recovery above the potential resistance of 18.00 in the Asian session. A recovery attempt by the US Dollar Index (DXY) after a nosedive move has infused some strength in the major. The USD Index has rebounded after printing a fresh weekly low of 101.20. The USD Index still needs to fulfill a lot of filters to prove a reversal.
S&P500 futures have extended their losses in the Asian session as investors are cautious ahead of quarterly results from giant technology stocks. The demand for US government bonds has increased as the Federal Reserve (Fed) is expected to deliver a neutral interest rate guidance after a 25 basis point (bp) interest rate hike.
USD/MXN is auctioning in a Descending Triangle chart pattern on a two-hour scale, which indicates a volatility contraction. The downward-sloping trendline of the aforementioned chart pattern is plotted from April 05 high at 18.40 while the horizontal support is placed from April 03 low at 17.96. The 20-period Exponential Moving Average (EMA) at 18.00 is overlapping the asset, indicating a sideways performance.
Also, the Relative Strength Index (RSI) (14) is oscillating in the 40.00-60.00 range, signaling an absence of a potential trigger.
A breakdown of April 03 low at 17.96 will drag the asset to a fresh five-year low below 26 September 2017 low at 17.88 followed by 25 September 2017 low at 17.72.
On the flip side, a break above April 19 high at 18.15 will drive the asset toward April 05 high at 18.40 and March 14 low at 18.55.
Technical Levels: Supports and Resistances
USDMXN currently trading at 17.9942 at the time of writing. Pair opened at 17.9822 and is trading with a change of 0.07 % .
| Overview | Overview.1 | |
|---|---|---|
| 0 | Today last price | 17.9942 |
| 1 | Today Daily Change | 0.0120 |
| 2 | Today Daily Change % | 0.0700 |
| 3 | Today daily open | 17.9822 |
The pair remains strongly bearish on the daily time frame. It trades below the 20 SMA @ 18.0938, 50 SMA 18.3032, 100 SMA @ 18.7448 and 200 SMA @ 19.3433.
| Trends | Trends.1 | |
|---|---|---|
| 0 | Daily SMA20 | 18.0938 |
| 1 | Daily SMA50 | 18.3032 |
| 2 | Daily SMA100 | 18.7448 |
| 3 | Daily SMA200 | 19.3433 |
The previous day high was 18.0479 while the previous day low was 17.966. The daily 38.2% Fib levels comes at 17.9973, expected to provide resistance. Similarly, the daily 61.8% fib level is at 18.0166, expected to provide resistance.
Note the levels of interest below:
- Pivot support is noted at 17.9495, 17.9168, 17.8676
- Pivot resistance is noted at 18.0314, 18.0806, 18.1133
| Levels | Levels.1 |
|---|---|
| Previous Daily High | 18.0479 |
| Previous Daily Low | 17.9660 |
| Previous Weekly High | 18.1542 |
| Previous Weekly Low | 17.9329 |
| Previous Monthly High | 19.2324 |
| Previous Monthly Low | 17.8977 |
| Daily Fibonacci 38.2% | 17.9973 |
| Daily Fibonacci 61.8% | 18.0166 |
| Daily Pivot Point S1 | 17.9495 |
| Daily Pivot Point S2 | 17.9168 |
| Daily Pivot Point S3 | 17.8676 |
| Daily Pivot Point R1 | 18.0314 |
| Daily Pivot Point R2 | 18.0806 |
| Daily Pivot Point R3 | 18.1133 |
[/s2If]
Nehcap Expert Advisor
The NEHCAP MT4 EA is high quality professional trading system geared to generate returns without using GRID or martingales. Each trade has strict risk per trade parameter. The pairs under management include EURUSD, GBPUSD, AUDCAD, AUDNZD,GBPAUD, EURAUD, EURCAD, CHFJPY and many more.
The system is trading live: LIVE ACCOUNT TRACKING
You can run it free. Apply for a free trial and track our account. Buy the system or use profit share mechanism to generate returns on your MT4.
Join Our Telegram Group
")


