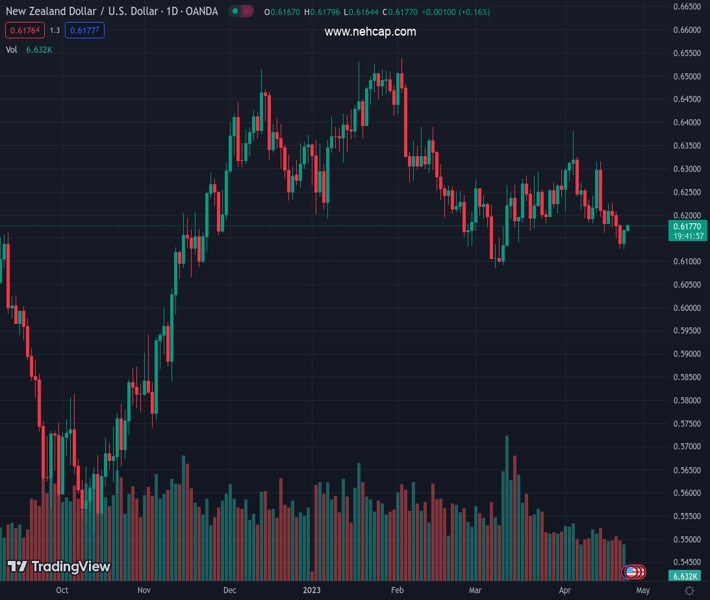
#NZDUSD @ 0.61743 is struggling to shore above 0.6180, however, the upside seems favored. (Pivot Orderbook analysis)
…
This is a premium post.
[s2If !current_user_can(access_s2member_level4)]Please register for FREE REGISTER to read full post below containing analysis. In case of any error or you think you are not able to read the full post below, please email us at support#nehcap.com [lwa][/s2If] [s2If current_user_can(access_s2member_level1)]
- NZD/USD is struggling to shore above 0.6180, however, the upside seems favored.
- US Durable Goods Orders data is seen expanding by 0.8% vs. a contraction of 1.0%.
- NZD/USD is in a markup phase after a test of the breakout region of the consolidation.
The pair currently trades last at 0.61743.
The previous day high was 0.617 while the previous day low was 0.6125. The daily 38.2% Fib levels comes at 0.6153, expected to provide support. Similarly, the daily 61.8% fib level is at 0.6142, expected to provide support.
The NZD/USD pair has recorded a steep run after shifting its business above 0.6150 in the Asian session. The Kiwi asset has shifted into a bullish trajectory amid a sell-off in the US Dollar Index (DXY). The USD Index has continued its declining trend to near 101.20 as the Federal Reserve (Fed) is set to announce a pause in the rate-hiking spree after a consecutive 25 basis point (bp) rate hike in May.
The USD Index is expected to remain in action ahead of the United States Durable Goods Orders data, which will release on Wednesday. For March, the Durable Goods Orders data is seen expanding by 0.8% vs. a contraction of 1.0%. Upbeat economic data will indicate a recovery in forward demand.
The New Zealand Dollar will show immense action after the release of Trade Balance data on Wednesday.
NZD/USD is in a markup phase after a test of the breakout region of the consolidation formed in a range of 0.6125-0.6156 on an hourly scale. The 20-period Exponential Moving Average (EMA) at 0.6158 is providing support to the New Zealand Dollar bulls.
The Relative Strength Index (RSI) (14) is oscillating in the bullish range of 60.00-80.00, indicating that the upside momentum is active.
Should the asset go for a healthy correction to near the 10-EMA at 0.6165, a bargain buy opportunity will emerge, which will drive the Kiwi asset toward the round-level resistance at 0.6200. A breach of the latter will allow the Kiwi to report a fresh weekly high above April 19 high at 0.6227.
Alternatively, a breakdown of April 20 low at 0.6148 will drag the asset toward April 24 low at 0.6125 followed by the round-level resistance at 0.6100.
Technical Levels: Supports and Resistances
NZDUSD currently trading at 0.6177 at the time of writing. Pair opened at 0.6167 and is trading with a change of 0.16 % .
| Overview | Overview.1 | |
|---|---|---|
| 0 | Today last price | 0.6177 |
| 1 | Today Daily Change | 0.0010 |
| 2 | Today Daily Change % | 0.1600 |
| 3 | Today daily open | 0.6167 |
The pair is trading below its 20 Daily moving average @ 0.6232, below its 50 Daily moving average @ 0.622 , below its 100 Daily moving average @ 0.6296 and above its 200 Daily moving average @ 0.6163
| Trends | Trends.1 | |
|---|---|---|
| 0 | Daily SMA20 | 0.6232 |
| 1 | Daily SMA50 | 0.6220 |
| 2 | Daily SMA100 | 0.6296 |
| 3 | Daily SMA200 | 0.6163 |
The previous day high was 0.617 while the previous day low was 0.6125. The daily 38.2% Fib levels comes at 0.6153, expected to provide support. Similarly, the daily 61.8% fib level is at 0.6142, expected to provide support.
Note the levels of interest below:
- Pivot support is noted at 0.6138, 0.6109, 0.6093
- Pivot resistance is noted at 0.6183, 0.6199, 0.6228
| Levels | Levels.1 |
|---|---|
| Previous Daily High | 0.6170 |
| Previous Daily Low | 0.6125 |
| Previous Weekly High | 0.6227 |
| Previous Weekly Low | 0.6126 |
| Previous Monthly High | 0.6298 |
| Previous Monthly Low | 0.6084 |
| Daily Fibonacci 38.2% | 0.6153 |
| Daily Fibonacci 61.8% | 0.6142 |
| Daily Pivot Point S1 | 0.6138 |
| Daily Pivot Point S2 | 0.6109 |
| Daily Pivot Point S3 | 0.6093 |
| Daily Pivot Point R1 | 0.6183 |
| Daily Pivot Point R2 | 0.6199 |
| Daily Pivot Point R3 | 0.6228 |
[/s2If]
Nehcap EA FIX downloadThe NEHCAP EA is high quality professional trading system geared to generate returns without using GRID or martingales.Each trade has strict risk per trade parameter. The pairs under management include EURUSD, GBPUSD, AUDCAD, AUDNZD,GBPAUD, EURAUD, EURCAD, CHFJPY and many more.The system is trading live: LIVE ACCOUNT TRACKING Apply for a free trial and track our account. Buy the system or use profit share mechanism to generate returns on your MT4.
Join Our Telegram Group
")


