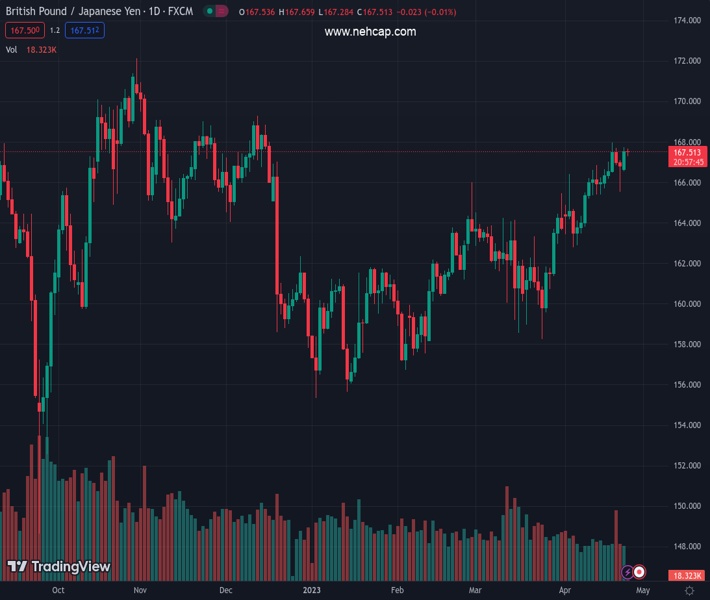
#GBPJPY @ 167.638 is making efforts for keeping business above 167.50 as BoE to raise rates further. (Pivot Orderbook analysis)
…
This is a premium post.
[s2If !current_user_can(access_s2member_level4)]Please register for FREE REGISTER to read full post below containing analysis. In case of any error or you think you are not able to read the full post below, please email us at support#nehcap.com [lwa][/s2If] [s2If current_user_can(access_s2member_level1)]
- GBP/JPY is making efforts for keeping business above 167.50 as BoE to raise rates further.
- A dovish stance is expected from the BoJ as Japan’s inflation is needed to sustain above 2%.
- GBP/JPY showed a V-shape recovery after getting support from the lower portion of the Rising Channel pattern.
The pair currently trades last at 167.638.
The previous day high was 167.1 while the previous day low was 165.52. The daily 38.2% Fib levels comes at 166.12, expected to provide support. Similarly, the daily 61.8% fib level is at 166.49, expected to provide support.
The GBP/JPY pair is working on keeping its auction above 167.50 in the early Asian session. The cross is broadly advancing from Friday as investors are expecting the continuation of interest rate hikes from the Bank of England (BoE) considering the fact that United Kingdom’s inflation is not willing to ditch the double-digit figure.
Labor shortage and food inflation have remained major drivers for stick UK inflation, which is why BoE policymakers are going through sleepless nights. Monthly UK’s Retail Sales contracted by 0.9% while the street was anticipating a contraction by 0.5%, which indicates that households are feeling the pain of inflation-adjusted prices of goods and services.
Meanwhile, new Bank of Japan (BoJ) Governor Kazuo Ueda is in favor of continuing the dovish policy stance to keep the inflation rate steadily above 2%.
On a six-hour scale, GBP/JPY showed a V-shape recovery after getting support from the lower portion of the Rising Channel chart pattern. Every pullback in the aforementioned chart pattern is considered as buying opportunity by the market participants. The Pound Sterling is driving the cross towards the horizontal resistance plotted from 13 December 2022 high at 169.28.
The Pound Sterling has managed to drive cross sustainably above the 20-period Exponential Moving Average (EMA) at 166.94, indicating that the short-term trend is bullish.
Meanwhile, the Relative Strength Index (RSI) (14) rebounded after sensing support near 40.00, signaling that the downside momentum was defended confidently.
Going forward, a decisive move above April 19 high around 168.00 will drive the cross 13 December 2022 high at 169.28 followed by November 02 high at 170.33.
On the flip side, a breakdown below April 21 low at 165.52 will strengthen the downside bias and will expose the cross to April 10 low at 164.00 and April 05 low at 162.78.
Technical Levels: Supports and Resistances
GBPJPY currently trading at 167.5 at the time of writing. Pair opened at 166.88 and is trading with a change of 0.37 % .
| Overview | Overview.1 | |
|---|---|---|
| 0 | Today last price | 167.50 |
| 1 | Today Daily Change | 0.62 |
| 2 | Today Daily Change % | 0.37 |
| 3 | Today daily open | 166.88 |
The pair remains strongly bullish on the daily timeframe. It trades above its 20 SMA @ 165.0, 50 SMA 163.27, 100 SMA @ 162.23 and 200 SMA @ 163.29.
| Trends | Trends.1 | |
|---|---|---|
| 0 | Daily SMA20 | 165.00 |
| 1 | Daily SMA50 | 163.27 |
| 2 | Daily SMA100 | 162.23 |
| 3 | Daily SMA200 | 163.29 |
The previous day high was 167.1 while the previous day low was 165.52. The daily 38.2% Fib levels comes at 166.12, expected to provide support. Similarly, the daily 61.8% fib level is at 166.49, expected to provide support.
Note the levels of interest below:
- Pivot support is noted at 165.9, 164.92, 164.32
- Pivot resistance is noted at 167.48, 168.08, 169.06
| Levels | Levels.1 |
|---|---|
| Previous Daily High | 167.10 |
| Previous Daily Low | 165.52 |
| Previous Weekly High | 167.98 |
| Previous Weekly Low | 165.52 |
| Previous Monthly High | 165.47 |
| Previous Monthly Low | 158.27 |
| Daily Fibonacci 38.2% | 166.12 |
| Daily Fibonacci 61.8% | 166.49 |
| Daily Pivot Point S1 | 165.90 |
| Daily Pivot Point S2 | 164.92 |
| Daily Pivot Point S3 | 164.32 |
| Daily Pivot Point R1 | 167.48 |
| Daily Pivot Point R2 | 168.08 |
| Daily Pivot Point R3 | 169.06 |
[/s2If]
Nehcap EA FIX downloadThe NEHCAP EA is high quality professional trading system geared to generate returns without using GRID or martingales.Each trade has strict risk per trade parameter. The pairs under management include EURUSD, GBPUSD, AUDCAD, AUDNZD,GBPAUD, EURAUD, EURCAD, CHFJPY and many more.The system is trading live: LIVE ACCOUNT TRACKING Apply for a free trial and track our account. Buy the system or use profit share mechanism to generate returns on your MT4.
Join Our Telegram Group
")


