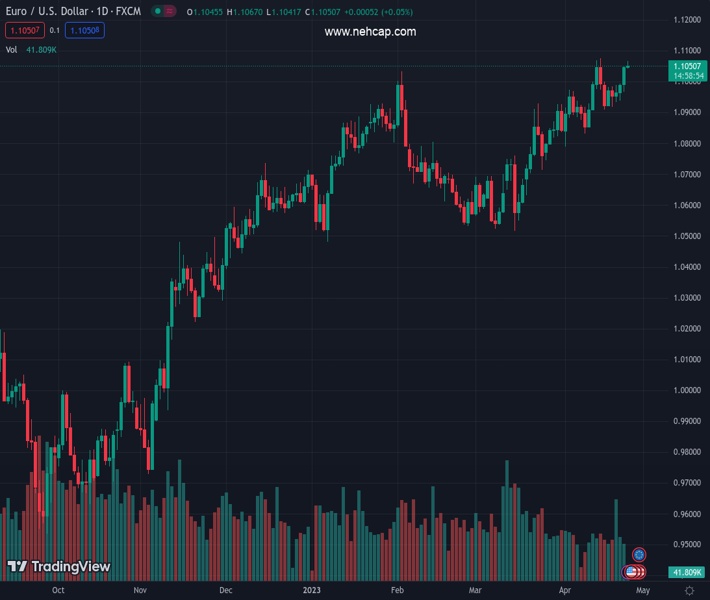
#EURUSD @ 1.10492 prods three-day winning streak while retreating from one-week-old horizontal hurdle., @nehcap view: Further downside expected (Pivot Orderbook analysis)
…
This is a premium post.
[s2If !current_user_can(access_s2member_level4)]Please register for FREE REGISTER to read full post below containing analysis. In case of any error or you think you are not able to read the full post below, please email us at support#nehcap.com [lwa][/s2If] [s2If current_user_can(access_s2member_level1)]
- EUR/USD prods three-day winning streak while retreating from one-week-old horizontal hurdle.
- Overbought RSI (14) line adds strength to the pullback moves targeting fortnight-long support zone.
- 200-HMA acts as an additional downside filter within short-term ascending triangle.
The pair currently trades last at 1.10492.
The previous day high was 1.105 while the previous day low was 1.0966. The daily 38.2% Fib levels comes at 1.1018, expected to provide support. Similarly, the daily 61.8% fib level is at 1.0998, expected to provide support.
EUR/USD is on the cusp of printing the first intraday loss in four as it takes offers to reverse intraday gains around a one-week high, falling to 1.1050 amid early Tuesday morning in Europe. In doing so, the Euro pair takes a U-turn from a short-term key horizontal resistance amid the overbought RSI (14) line.
With this, the EUR/USD sellers are well set to test a two-week-old horizontal support zone of around 1.1000.
However, the 200-Hour Moving Average (HMA) and an upward-sloping trend line from April 10, forming part of a bearish triangle formation, respectively near 1.0985 and 1.0960, can challenge the EUR/USD bears afterward.
In a case where the Euro pair drops below 1.0960, the odds of witnessing a south run towards the 61.8% Fibonacci retracement level of April 10-14 upside, near 1.0930, can act as the last defense of the EUR/USD buyers.
On the contrary, a sustained break of the stated triangle’s top line, close to 1.1070, will defy the bearish chart pattern and can prod the latest multi-month high of around 1.1075.
Though, the EUR/USD pair’s successful trading beyond 1.1075 won’t hesitate to challenge the late March 2022 high surrounding 1.1185.
Overall, EUR/USD pair is likely to decline in the short term but the bullish trend remains intact unless the quote stays beyond 1.0930.
Trend: Further downside expected
Technical Levels: Supports and Resistances
EURUSD currently trading at 1.105 at the time of writing. Pair opened at 1.1046 and is trading with a change of 0.04% % .
| Overview | Overview.1 | |
|---|---|---|
| 0 | Today last price | 1.105 |
| 1 | Today Daily Change | 0.0004 |
| 2 | Today Daily Change % | 0.04% |
| 3 | Today daily open | 1.1046 |
The pair remains strongly bullish on the daily timeframe. It trades above its 20 SMA @ 1.0934, 50 SMA 1.0774, 100 SMA @ 1.0742 and 200 SMA @ 1.0398.
| Trends | Trends.1 | |
|---|---|---|
| 0 | Daily SMA20 | 1.0934 |
| 1 | Daily SMA50 | 1.0774 |
| 2 | Daily SMA100 | 1.0742 |
| 3 | Daily SMA200 | 1.0398 |
The previous day high was 1.105 while the previous day low was 1.0966. The daily 38.2% Fib levels comes at 1.1018, expected to provide support. Similarly, the daily 61.8% fib level is at 1.0998, expected to provide support.
Note the levels of interest below:
- Pivot support is noted at 1.0991, 1.0937, 1.0907
- Pivot resistance is noted at 1.1076, 1.1105, 1.116
| Levels | Levels.1 |
|---|---|
| Previous Daily High | 1.1050 |
| Previous Daily Low | 1.0966 |
| Previous Weekly High | 1.1000 |
| Previous Weekly Low | 1.0909 |
| Previous Monthly High | 1.0930 |
| Previous Monthly Low | 1.0516 |
| Daily Fibonacci 38.2% | 1.1018 |
| Daily Fibonacci 61.8% | 1.0998 |
| Daily Pivot Point S1 | 1.0991 |
| Daily Pivot Point S2 | 1.0937 |
| Daily Pivot Point S3 | 1.0907 |
| Daily Pivot Point R1 | 1.1076 |
| Daily Pivot Point R2 | 1.1105 |
| Daily Pivot Point R3 | 1.1160 |
[/s2If]
Nehcap Expert Advisor
The NEHCAP MT4 EA is high quality professional trading system geared to generate returns without using GRID or martingales. Each trade has strict risk per trade parameter. The pairs under management include EURUSD, GBPUSD, AUDCAD, AUDNZD,GBPAUD, EURAUD, EURCAD, CHFJPY and many more.
The system is trading live: LIVE ACCOUNT TRACKING
You can run it free. Apply for a free trial and track our account. Buy the system or use profit share mechanism to generate returns on your MT4.
Join Our Telegram Group
")


