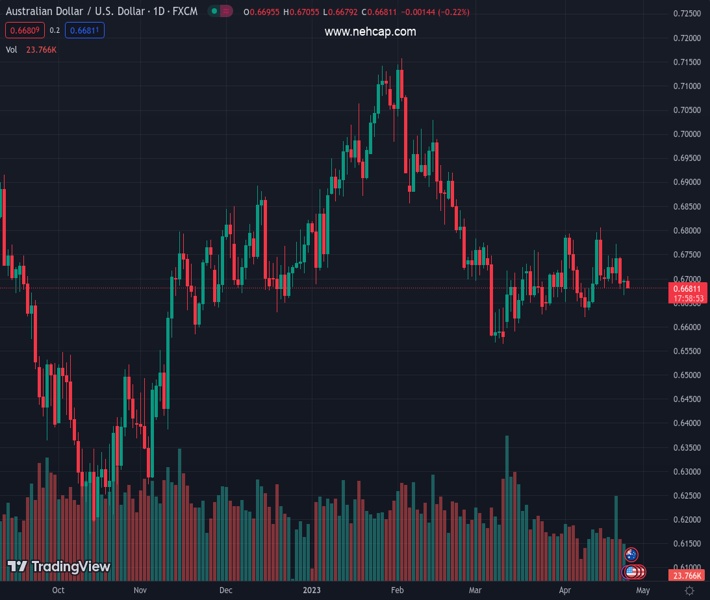
#AUDUSD @ 0.66814 takes offers to refresh intraday low, reverses week-start bounce from the lowest levels in fortnight. (Pivot Orderbook analysis)
…
This is a premium post.
[s2If !current_user_can(access_s2member_level4)]Please register for FREE REGISTER to read full post below containing analysis. In case of any error or you think you are not able to read the full post below, please email us at support#nehcap.com [lwa][/s2If] [s2If current_user_can(access_s2member_level1)]
- AUD/USD takes offers to refresh intraday low, reverses week-start bounce from the lowest levels in fortnight.
- Market sentiment dwindles amid US debt ceiling concerns, cautious mood ahead of top-tier data/events.
- Fed blackout, off in Australia allow traders to consolidate recent moves.
- US CB Consumer Confidence, yields eyed for intraday directions.
The pair currently trades last at 0.66814.
The previous day high was 0.6699 while the previous day low was 0.6666. The daily 38.2% Fib levels comes at 0.6686, expected to provide resistance. Similarly, the daily 61.8% fib level is at 0.6678, expected to provide support.
AUD/USD renews its intraday low near 0.6680 amid sour sentiment during early Tuesday. In doing so, the Aussie pair reverses the corrective bounce from a two-week low marked the previous day.
While watching over the risk catalysts, escalated indecision among the US policymakers amid the looming debt ceiling expiration in June weighs on the market sentiment of late. On the same line is the trader’s preparation for the US Federal Reserve’s (Fed) one last rate hike, worth 0.25%, in May before signaling the policy pivot.
“Kevin McCarthy and his vote-counting lieutenants are telling fellow Republicans they will not change their $1.5 trillion debt-ceiling proposal, despite rank-and-file GOP demands for alterations,” said Bloomberg on Monday.
On the other hand, CME’s FedWatch Tool hints at an almost 90% probability of the US central bank’s 0.25% rate lift in May. However, concerns surrounding a policy pivot and rate cuts in 2023 seem to keep traders on their toes.
Additionally, the geopolitical fears surrounding Russia and China join the market’s cautious mood ahead of this week’s top-tier growth and inflation data to prod the sentiment. China’s alleged support to Moscow in fighting with Ukraine joins the Western readiness to increase sanctions on the Oil-rich nation to weigh on sentiment.
Against this backdrop, S&P 500 Futures print mild losses near 4,155 as it snaps a two-day uptrend after mixed closing of the Wall Street benchmarks. On the other hand, the US Treasury bond yields highlight the rush for risk safety as the benchmark 10-year bond coupons drop to 3.48% at the latest. More importantly, the difference between the one-month and the three-month US Treasury bond yields widen the most since 2001 as the coupons flash 3.48% and 4.98% mark of late.
Given the ANZAC Day holidays in Australia and New Zealand, the AUD/USD pair may extend the latest fall amid mildly downbeat markets. However, US Conference Board’s (CB) Consumer Confidence gauge for April, expected to remain steady near 104.1 versus 104.2 prior, will be important for the intraday directions.
AUD/USD retreats from the 21-DMA hurdle surrounding 0.6705, which in turn joins downbeat oscillators to direct the Aussie pair sellers toward an upward-sloping support line from early March, close to 0.6650 at the latest.
Technical Levels: Supports and Resistances
AUDUSD currently trading at 0.668 at the time of writing. Pair opened at 0.6696 and is trading with a change of -0.24% % .
| Overview | Overview.1 | |
|---|---|---|
| 0 | Today last price | 0.668 |
| 1 | Today Daily Change | -0.0016 |
| 2 | Today Daily Change % | -0.24% |
| 3 | Today daily open | 0.6696 |
The pair remains strongly bearish on the daily time frame. It trades below the 20 SMA @ 0.6706, 50 SMA 0.6721, 100 SMA @ 0.6798 and 200 SMA @ 0.6742.
| Trends | Trends.1 | |
|---|---|---|
| 0 | Daily SMA20 | 0.6706 |
| 1 | Daily SMA50 | 0.6721 |
| 2 | Daily SMA100 | 0.6798 |
| 3 | Daily SMA200 | 0.6742 |
The previous day high was 0.6699 while the previous day low was 0.6666. The daily 38.2% Fib levels comes at 0.6686, expected to provide resistance. Similarly, the daily 61.8% fib level is at 0.6678, expected to provide support.
Note the levels of interest below:
- Pivot support is noted at 0.6675, 0.6653, 0.6641
- Pivot resistance is noted at 0.6708, 0.672, 0.6742
| Levels | Levels.1 |
|---|---|
| Previous Daily High | 0.6699 |
| Previous Daily Low | 0.6666 |
| Previous Weekly High | 0.6772 |
| Previous Weekly Low | 0.6678 |
| Previous Monthly High | 0.6784 |
| Previous Monthly Low | 0.6564 |
| Daily Fibonacci 38.2% | 0.6686 |
| Daily Fibonacci 61.8% | 0.6678 |
| Daily Pivot Point S1 | 0.6675 |
| Daily Pivot Point S2 | 0.6653 |
| Daily Pivot Point S3 | 0.6641 |
| Daily Pivot Point R1 | 0.6708 |
| Daily Pivot Point R2 | 0.6720 |
| Daily Pivot Point R3 | 0.6742 |
[/s2If]
Nehcap EA FIX downloadThe NEHCAP EA is high quality professional trading system geared to generate returns without using GRID or martingales.Each trade has strict risk per trade parameter. The pairs under management include EURUSD, GBPUSD, AUDCAD, AUDNZD,GBPAUD, EURAUD, EURCAD, CHFJPY and many more.The system is trading live: LIVE ACCOUNT TRACKING Apply for a free trial and track our account. Buy the system or use profit share mechanism to generate returns on your MT4.
Join Our Telegram Group
")


