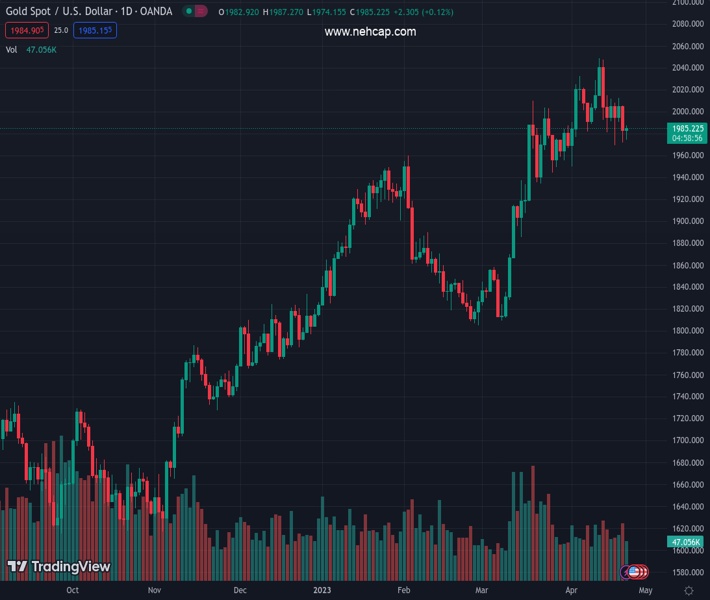
#XAUUSD @ 1,985.13 Fed Cook: Monetary policy enters uncertain phase, though expect PCE to slow down (Pivot Orderbook analysis)
…
This is a premium post.
[s2If !current_user_can(access_s2member_level4)]Please register for FREE REGISTER to read full post below containing analysis. In case of any error or you think you are not able to read the full post below, please email us at support#nehcap.com [lwa][/s2If] [s2If current_user_can(access_s2member_level1)]
- Fed Cook: Monetary policy enters uncertain phase, though expect PCE to slow down
- The Chicago Fed National Activity Index improved, but the Dallas Fed manufacturing index deteriorated.
- XAU/USD Price Analysis: Likely to remain sideways, between the 20 and 50-day EMAs.
The pair currently trades last at 1985.13.
The previous day high was 2005.58 while the previous day low was 1971.62. The daily 38.2% Fib levels comes at 1984.59, expected to provide support. Similarly, the daily 61.8% fib level is at 1992.61, expected to provide resistance.
Gold price is trading sideways amidst the lack of a catalyst during Monday’s North American session, though likely to remain underpinned by US Dollar (USD) weakness and falling US Treasury bond yields. A risk-on impulse keeps the greenback pressured during a week of a light US economic agenda. At the time of writing, the XAU/USD is trading at $1983.50, almost flat.
US stocks fluctuate between gainers and losers as the week begins. With US Federal Reserve (Fed) officials getting into the blackout period, Gold traders are leaning to last Friday’s Lisa Cook, Fed Governor words. She said that monetary policy is moving into an uncertain phase and added that banking sector headwinds could weigh on the rate-rising outlook. Cook expects March PCE inflation to decelerate and refrained from asserting the same to core PCE.
US Treasury bond yields, across the board, continue to tumble, a headwind for the greenback. The US Dollar Index (DXY), a measure of the buck’s value against a basket of peers, lost traction, sliding 0.22%, and was last seen at 101.507, a tailwind for XAU/USD.
Expectations of the US Federal Reserve hiking rates by 25 bps in the next week lie at 90%, as shown by the CME FedWatch Tool. Nevertheless, traders estimate that the US central bank “could” cut rates by the September meeting, followed by another one in December.
Over the weekend, reports via the Financial Times reported that central bankers are buying gold, spurred by increased geopolitical tensions, as the World Gould Council said. The reports showed that central banks increased by 152% YoY in 2022.
Data-wise, the US economic docket featured the Chicago Fed National Activity Index (CFNAI) for March, which plunged to -0.19, above estimates of -20, unchanged from February’s reading. The three-month moving average ticked up to 0.01%, which jumped from -0.09 in February, a sign that the economy continues to expand at a slower pace.
Of late, the Dallas Fed Manufacturing Business Index in April plummeted to -23.4, well below the -11.00 estimated, as the survey showed that perceptions of broader business conditions worsened, according to the poll. The rate of change of orders and shipments improved, but both readings remained in negative territory.
From a technical perspective, XAU/USD is wavering around the 20-day Exponential Moving Average (EMA) at $1987.64, suggesting that the Gold price will likely remain sideways. On the downside, risks lie at $1950 before dropping and testing the 50-day EMA at $1946.45. A breach of the latter will expose the $1900 figure, ahead of the 100-day EMA at $1897.58. Conversely, upside risks are at the 20-day EMA, followed by the $2000 mark.
Technical Levels: Supports and Resistances
XAUUSD currently trading at 1984.53 at the time of writing. Pair opened at 1983.02 and is trading with a change of 0.08 % .
| Overview | Overview.1 | |
|---|---|---|
| 0 | Today last price | 1984.53 |
| 1 | Today Daily Change | 1.51 |
| 2 | Today Daily Change % | 0.08 |
| 3 | Today daily open | 1983.02 |
The pair is trading below its 20 Daily moving average @ 1994.67, above its 50 Daily moving average @ 1919.91 , above its 100 Daily moving average @ 1887.1 and above its 200 Daily moving average @ 1800.37
| Trends | Trends.1 | |
|---|---|---|
| 0 | Daily SMA20 | 1994.67 |
| 1 | Daily SMA50 | 1919.91 |
| 2 | Daily SMA100 | 1887.10 |
| 3 | Daily SMA200 | 1800.37 |
The previous day high was 2005.58 while the previous day low was 1971.62. The daily 38.2% Fib levels comes at 1984.59, expected to provide support. Similarly, the daily 61.8% fib level is at 1992.61, expected to provide resistance.
Note the levels of interest below:
- Pivot support is noted at 1967.9, 1952.78, 1933.94
- Pivot resistance is noted at 2001.86, 2020.7, 2035.82
| Levels | Levels.1 |
|---|---|
| Previous Daily High | 2005.58 |
| Previous Daily Low | 1971.62 |
| Previous Weekly High | 2015.13 |
| Previous Weekly Low | 1969.26 |
| Previous Monthly High | 2009.88 |
| Previous Monthly Low | 1809.46 |
| Daily Fibonacci 38.2% | 1984.59 |
| Daily Fibonacci 61.8% | 1992.61 |
| Daily Pivot Point S1 | 1967.90 |
| Daily Pivot Point S2 | 1952.78 |
| Daily Pivot Point S3 | 1933.94 |
| Daily Pivot Point R1 | 2001.86 |
| Daily Pivot Point R2 | 2020.70 |
| Daily Pivot Point R3 | 2035.82 |
[/s2If]
Nehcap EA FIX downloadThe NEHCAP EA is high quality professional trading system geared to generate returns without using GRID or martingales.Each trade has strict risk per trade parameter. The pairs under management include EURUSD, GBPUSD, AUDCAD, AUDNZD,GBPAUD, EURAUD, EURCAD, CHFJPY and many more.The system is trading live: LIVE ACCOUNT TRACKING Apply for a free trial and track our account. Buy the system or use profit share mechanism to generate returns on your MT4.
Join Our Telegram Group
")


