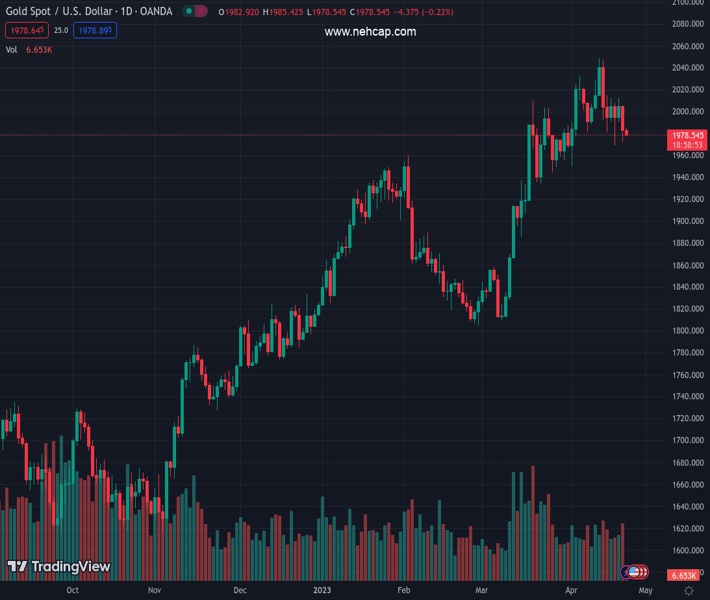
#XAUUSD @ 1,979.82 Gold price is keeping its auction steadily above $1,980.00 amid the subdued USD Index. (Pivot Orderbook analysis)
…
This is a premium post.
[s2If !current_user_can(access_s2member_level4)]Please register for PREMIUM VERSION HERE to read full post below containing analysis. In case of any error or you think you are not able to read the full post below, please email us at support#nehcap.com [lwa][/s2If] [s2If current_user_can(access_s2member_level4)]
- Gold price is keeping its auction steadily above $1,980.00 amid the subdued USD Index.
- S&P500 futures have generated losses as investors are anxious ahead of quarterly results from giant technology stocks.
- Gold price is expected to display sheer weakness after a breakdown of immediate support plotted from $1,969.26.
The pair currently trades last at 1979.82.
The previous day high was 2005.58 while the previous day low was 1971.62. The daily 38.2% Fib levels comes at 1984.59, expected to provide resistance. Similarly, the daily 61.8% fib level is at 1992.61, expected to provide resistance.
Gold price (XAU/USD) is holding its auction above the critical support of $1,980.00 in the Asian session. The precious metal is struggling around $1,985.00 as the US Dollar Index (DXY) is showing mixed signals around its crucial support of 101.63. After topsy-turvy moves in a wide range of 101.63-102.27 for the past four trading sessions, investors are anticipating a decisive move from the USD Index.
S&P500 futures are holding onto losses in the Asian session as investors are anxious ahead of quarterly results from giant technology stocks. Amazon, Facebook, and Google are expected to keep investors busy this week with their first-quarter CY2023 results. The yields offered on US government bonds have dropped marginally amid a subdued performance by the US Dollar Index. The 10-year US Treasury yields have dropped to near 3.56%.
This week, the USD Index will dance to the tunes of Durable Goods Orders (March) data. The economic data is seen expanding by 0.8% vs. a contraction of 1.0%. A recovery in demand for Durable Goods indicates that households’ demand is recovering, which could further lift core inflation expectations. An upbeat economic data would be supportive to more rate hikes from the Federal Reserve (Fed).
Gold price has delivered a breakdown of the Head and Shoulder chart pattern formed on a two-hour scale. The precious metal might display more weakness after slipping below the immediate support plotted from April 19 low at $1,969.26.
Declining 20-and 50-period Exponential Moving Averages (EMAs) at $1,988.00 and $1,994.78 respectively, add to the downside filters.
The downside momentum will get triggered if the Relative Strength Index (RSI) (14) will drop into the bearish range of 20.00-40.00.
Technical Levels: Supports and Resistances
XAUUSD currently trading at 1982.5 at the time of writing. Pair opened at 1983.02 and is trading with a change of -0.03 % .
| Overview | Overview.1 | |
|---|---|---|
| 0 | Today last price | 1982.50 |
| 1 | Today Daily Change | -0.52 |
| 2 | Today Daily Change % | -0.03 |
| 3 | Today daily open | 1983.02 |
The pair is trading below its 20 Daily moving average @ 1994.67, above its 50 Daily moving average @ 1919.91 , above its 100 Daily moving average @ 1887.1 and above its 200 Daily moving average @ 1800.37
| Trends | Trends.1 | |
|---|---|---|
| 0 | Daily SMA20 | 1994.67 |
| 1 | Daily SMA50 | 1919.91 |
| 2 | Daily SMA100 | 1887.10 |
| 3 | Daily SMA200 | 1800.37 |
The previous day high was 2005.58 while the previous day low was 1971.62. The daily 38.2% Fib levels comes at 1984.59, expected to provide resistance. Similarly, the daily 61.8% fib level is at 1992.61, expected to provide resistance.
Note the levels of interest below:
- Pivot support is noted at 1967.9, 1952.78, 1933.94
- Pivot resistance is noted at 2001.86, 2020.7, 2035.82
| Levels | Levels.1 |
|---|---|
| Previous Daily High | 2005.58 |
| Previous Daily Low | 1971.62 |
| Previous Weekly High | 2015.13 |
| Previous Weekly Low | 1969.26 |
| Previous Monthly High | 2009.88 |
| Previous Monthly Low | 1809.46 |
| Daily Fibonacci 38.2% | 1984.59 |
| Daily Fibonacci 61.8% | 1992.61 |
| Daily Pivot Point S1 | 1967.90 |
| Daily Pivot Point S2 | 1952.78 |
| Daily Pivot Point S3 | 1933.94 |
| Daily Pivot Point R1 | 2001.86 |
| Daily Pivot Point R2 | 2020.70 |
| Daily Pivot Point R3 | 2035.82 |
[/s2If]
Join Our Telegram Group
")


