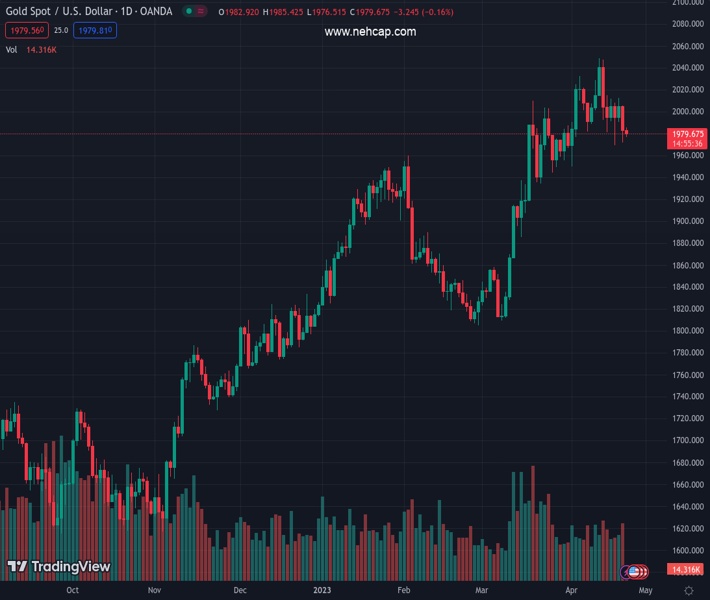
#XAUUSD @ 1,979.53 Gold price remains depressed for the second successive day amid a modest US Dollar uptick. (Pivot Orderbook analysis)
…
This is a premium post.
[s2If !current_user_can(access_s2member_level4)]Please register for PREMIUM VERSION HERE to read full post below containing analysis. In case of any error or you think you are not able to read the full post below, please email us at support#nehcap.com [lwa][/s2If] [s2If current_user_can(access_s2member_level4)]
- Gold price remains depressed for the second successive day amid a modest US Dollar uptick.
- Bets for more rate hikes by Federal Reserve underpin the buck and weigh on the XAU/USD.
- Looming recession risk and a softer risk tone help limit the downside for the safe-haven metal.
The pair currently trades last at 1979.53.
The previous day high was 2005.58 while the previous day low was 1971.62. The daily 38.2% Fib levels comes at 1984.59, expected to provide resistance. Similarly, the daily 61.8% fib level is at 1992.61, expected to provide resistance.
Gold price struggles to capitalize on Friday’s modest bounce from the $1.970 region and comes under some selling pressure on the first day of the new week. The XAU/USD trades around the $1,977 area during the Asian session and remains well within the striking distance of over a two-week low touched last Wednesday.
The prospects for further policy tightening by the Federal Reserve (Fed) assists the US Dollar to attract some buying on Monday, which, in turn, is seen as a key factor dragging Gold price lower for the second successive day. In fact, the markets now seem convinced that the Fed will continue raising interest rates to curb high inflation in the United States (US) and have fully priced in a 25 bps lift-off at the next Federal Open Market Committee (FOMC) policy meeting in May. Adding to this, the Fed funds future indicates a small chance of another rate hike in June.
The bets were lifted by the recent hawkish comments by several Fed officials and the incoming positive US macro data, which suggested that the world’s largest economy remained resilient. The flash version of S&P Global’s PMI survey showed on Friday that the overall business activity in the US private sector expanded at a faster pace in April. The activity in the service sector grew for a third straight month and at the fastest rate in a year, while the gauge for the US manufacturing sector moved into the expansion territory for the first time since October 2022.
That said, a softer tone around the US Treasury bond yields is holding back the USD bulls from placing aggressive bets and lending support to Gold price. Furthermore, a fresh leg down in the equity markets further contributes to limiting the downside for the precious metal. The prospects for further policy tightening by the Fed fuel worries about economic headwinds stemming from rising borrowing costs, which, in turn, tempers investors’ appetite for riskier assets and boosts demand for traditional safe-haven assets, including the XAU/USD.
There isn’t any relevant market-moving economic data due for release from the US on Monday, leaving the USD at the mercy of the US bond yields. Apart from this, traders will take cues from the broader risk sentiment to grab short-term opportunities around the Gold price. Nevertheless, the aforementioned fundamental backdrop and the lack of any meaningful buying suggests that the path of least resistance for the XAU/USD is to the downside.
From a technical perspective, bearish traders might now wait for some follow-through selling below the $1,969 region before positioning for an extension of the recent retracement slide from a one-year high. The Gold price might then slide towards testing the next relevant support near the $1,956-$1,955 area before eventually dropping to the monthly low around the $1,950 region.
On the flip side, any meaningful recovery attempt is likely to attract fresh sellers near the $2,000 psychological mark and remain capped near the $2,010 barrier. A sustained strength beyond the latter might trigger a fresh bout of a short-covering and lift Gold price beyond the $2,020 hurdle, towards the $2,040 horizontal zone en route to the YTD peak, around the $2,047-$2,049 region.
Technical Levels: Supports and Resistances
XAUUSD currently trading at 1977.76 at the time of writing. Pair opened at 1983.02 and is trading with a change of -0.27 % .
| Overview | Overview.1 | |
|---|---|---|
| 0 | Today last price | 1977.76 |
| 1 | Today Daily Change | -5.26 |
| 2 | Today Daily Change % | -0.27 |
| 3 | Today daily open | 1983.02 |
The pair is trading below its 20 Daily moving average @ 1994.67, above its 50 Daily moving average @ 1919.91 , above its 100 Daily moving average @ 1887.1 and above its 200 Daily moving average @ 1800.37
| Trends | Trends.1 | |
|---|---|---|
| 0 | Daily SMA20 | 1994.67 |
| 1 | Daily SMA50 | 1919.91 |
| 2 | Daily SMA100 | 1887.10 |
| 3 | Daily SMA200 | 1800.37 |
The previous day high was 2005.58 while the previous day low was 1971.62. The daily 38.2% Fib levels comes at 1984.59, expected to provide resistance. Similarly, the daily 61.8% fib level is at 1992.61, expected to provide resistance.
Note the levels of interest below:
- Pivot support is noted at 1967.9, 1952.78, 1933.94
- Pivot resistance is noted at 2001.86, 2020.7, 2035.82
| Levels | Levels.1 |
|---|---|
| Previous Daily High | 2005.58 |
| Previous Daily Low | 1971.62 |
| Previous Weekly High | 2015.13 |
| Previous Weekly Low | 1969.26 |
| Previous Monthly High | 2009.88 |
| Previous Monthly Low | 1809.46 |
| Daily Fibonacci 38.2% | 1984.59 |
| Daily Fibonacci 61.8% | 1992.61 |
| Daily Pivot Point S1 | 1967.90 |
| Daily Pivot Point S2 | 1952.78 |
| Daily Pivot Point S3 | 1933.94 |
| Daily Pivot Point R1 | 2001.86 |
| Daily Pivot Point R2 | 2020.70 |
| Daily Pivot Point R3 | 2035.82 |
[/s2If]
Join Our Telegram Group
")


