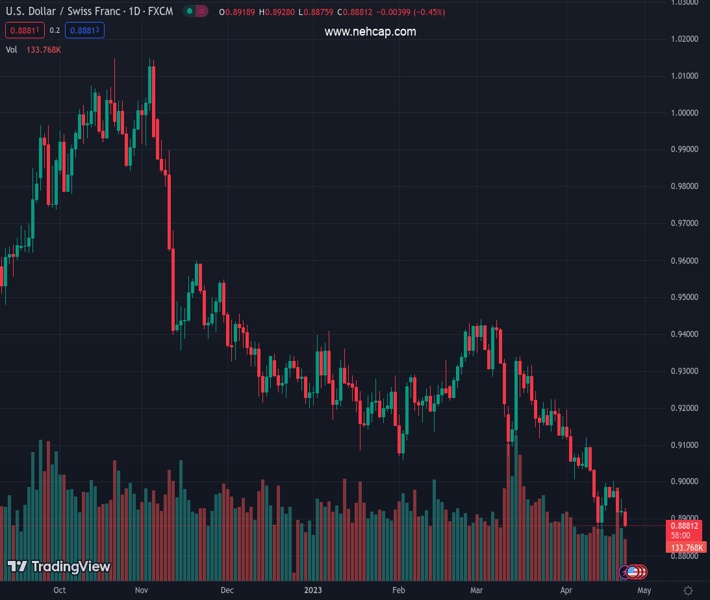
#USDCHF @ 0.88809 drops almost 0.50% on Monday on a weak US Dollar. (Pivot Orderbook analysis)
…
This is a premium post.
[s2If !current_user_can(access_s2member_level4)]Please register for FREE REGISTER to read full post below containing analysis. In case of any error or you think you are not able to read the full post below, please email us at support#nehcap.com [lwa][/s2If] [s2If current_user_can(access_s2member_level1)]
- USD/CHF drops almost 0.50% on Monday on a weak US Dollar.
- USD/CHF: Is a falling-wedge pattern setting the stage for a reversal?
The pair currently trades last at 0.88809.
The previous day high was 0.8954 while the previous day low was 0.8908. The daily 38.2% Fib levels comes at 0.8937, expected to provide resistance. Similarly, the daily 61.8% fib level is at 0.8926, expected to provide resistance.
The USD/CHF continues its downward trajectory, extending its losses after last Friday’s doji, suggesting that a bottom was reached at 0.8907. Nevertheless, late in the New York session, the USD/CHF pair is trading at 0.8879, below its opening price by 0.46%, after hitting a high of 0.8928.
Even though last week’s high pierced the 0.9000 figure, and buyers could not decisively crack the latter and test the 20-day Exponential Moving Average (EMA), it cemented that the USD/CHF is bearishly biased. However, it appears that a falling wedge, preceded by a downtrend, is forming, which sometimes can act as a reversal pattern. That suggests that the USD/CHF could be poised for an upward correction before falling past the actual YTD low at 0.8859.
If the USD/CHF breaks above the falling-wedge top trendline, the pair could rally initially, towards the measured objective, at around the 100-day EMA at 0.9240. But on the USD/CHF’s way up, buyers need to reclaim key resistance levels. First, the 0.9000 figure, followed by the April 10 high at 0.9120. A breach of the latter will expose the 0.9200 figure.
Conversely, a continuation past the YTD low of 0.8859 is on the cards, based on the Relative Strength Index (RSI) staying at bearish territory, followed by the Rate of Change (RoC) of three periods, indicating a fall of -1.04 in USD/CHF prices.
Technical Levels: Supports and Resistances
USDCHF currently trading at 0.8882 at the time of writing. Pair opened at 0.8922 and is trading with a change of -0.45 % .
| Overview | Overview.1 | |
|---|---|---|
| 0 | Today last price | 0.8882 |
| 1 | Today Daily Change | -0.0040 |
| 2 | Today Daily Change % | -0.4500 |
| 3 | Today daily open | 0.8922 |
The pair remains strongly bearish on the daily time frame. It trades below the 20 SMA @ 0.9043, 50 SMA 0.9189, 100 SMA @ 0.9228 and 200 SMA @ 0.9467.
| Trends | Trends.1 | |
|---|---|---|
| 0 | Daily SMA20 | 0.9043 |
| 1 | Daily SMA50 | 0.9189 |
| 2 | Daily SMA100 | 0.9228 |
| 3 | Daily SMA200 | 0.9467 |
The previous day high was 0.8954 while the previous day low was 0.8908. The daily 38.2% Fib levels comes at 0.8937, expected to provide resistance. Similarly, the daily 61.8% fib level is at 0.8926, expected to provide resistance.
Note the levels of interest below:
- Pivot support is noted at 0.8901, 0.8881, 0.8855
- Pivot resistance is noted at 0.8948, 0.8975, 0.8995
| Levels | Levels.1 |
|---|---|
| Previous Daily High | 0.8954 |
| Previous Daily Low | 0.8908 |
| Previous Weekly High | 0.9003 |
| Previous Weekly Low | 0.8908 |
| Previous Monthly High | 0.9440 |
| Previous Monthly Low | 0.9072 |
| Daily Fibonacci 38.2% | 0.8937 |
| Daily Fibonacci 61.8% | 0.8926 |
| Daily Pivot Point S1 | 0.8901 |
| Daily Pivot Point S2 | 0.8881 |
| Daily Pivot Point S3 | 0.8855 |
| Daily Pivot Point R1 | 0.8948 |
| Daily Pivot Point R2 | 0.8975 |
| Daily Pivot Point R3 | 0.8995 |
[/s2If]
Nehcap EA FIX downloadThe NEHCAP EA is high quality professional trading system geared to generate returns without using GRID or martingales.Each trade has strict risk per trade parameter. The pairs under management include EURUSD, GBPUSD, AUDCAD, AUDNZD,GBPAUD, EURAUD, EURCAD, CHFJPY and many more.The system is trading live: LIVE ACCOUNT TRACKING Apply for a free trial and track our account. Buy the system or use profit share mechanism to generate returns on your MT4.
Join Our Telegram Group
")


