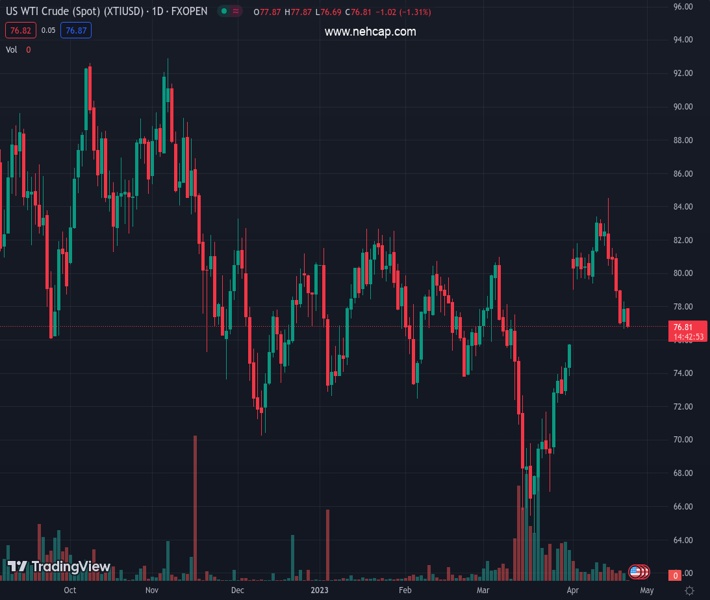
Oil prices have slipped sharply to near $76.75 in hopes of a global slowdown. (Pivot Orderbook analysis)
…
This is a premium post.
[s2If !current_user_can(access_s2member_level4)]Please register for PREMIUM VERSION HERE to read full post below containing analysis. In case of any error or you think you are not able to read the full post below, please email us at support#nehcap.com [lwa][/s2If] [s2If current_user_can(access_s2member_level4)]
- Oil prices have slipped sharply to near $76.75 in hopes of a global slowdown.
- Western central banks are expected to raise interest rates further to soften galloping inflation.
- Mixed global PMIs would force analysts to a downward revision in the oil demand.
The pair currently trades last at 76.8.
The previous day high was 78.34 while the previous day low was 76.69. The daily 38.2% Fib levels comes at 77.71, expected to provide resistance. Similarly, the daily 61.8% fib level is at 77.32, expected to provide resistance.
West Texas Intermediate (WTI), futures on NYMEX, have shown a perpendicular fall below $77.00 in the early European session. The oil price has sensed immense pressure after the release of mixed global Purchasing Managers Index (PMI) numbers and accelerating fears of more interest rate hikes from the Western central banks.
The recovery move in the US Dollar Index (DXY) has also weighed heavily on the oil price. The USD Index has reached near 101.85 after a recovery move as upbeat preliminary United States S&P PMI figures have strengthened expectations of consecutive 25 basis points (bps) interest rate hike from the Federal Reserve (Fed).
Friday’s global PMI data indicated that the US economy is recovering firmly as figures beat estimates strongly. In the shared continent and the United Kingdom economy, Manufacturing PMIs fell sharply and propelled fears of a decline in oil’s forward demand. In spite of slowdown fears, central banks of the respective economies are bound to raise interest rates further to arrest stubborn inflation.
The Bank of England (BoE) is expected to hike rates further by 25 bps to 4.5% and the European Central Bank (ECB) would follow the same path and will push rates to 3.75%. This may impact the oil demand forecast further.
Technical Levels: Supports and Resistances
XTIUSD currently trading at 76.8 at the time of writing. Pair opened at 77.92 and is trading with a change of -1.44 % .
| Overview | Overview.1 | |
|---|---|---|
| 0 | Today last price | 76.80 |
| 1 | Today Daily Change | -1.12 |
| 2 | Today Daily Change % | -1.44 |
| 3 | Today daily open | 77.92 |
The pair is trading below its 20 Daily moving average @ 78.32, above its 50 Daily moving average @ 76.41 , below its 100 Daily moving average @ 76.94 and below its 200 Daily moving average @ 82.15
| Trends | Trends.1 | |
|---|---|---|
| 0 | Daily SMA20 | 78.32 |
| 1 | Daily SMA50 | 76.41 |
| 2 | Daily SMA100 | 76.94 |
| 3 | Daily SMA200 | 82.15 |
The previous day high was 78.34 while the previous day low was 76.69. The daily 38.2% Fib levels comes at 77.71, expected to provide resistance. Similarly, the daily 61.8% fib level is at 77.32, expected to provide resistance.
Note the levels of interest below:
- Pivot support is noted at 76.96, 76.0, 75.31
- Pivot resistance is noted at 78.61, 79.3, 80.26
| Levels | Levels.1 |
|---|---|
| Previous Daily High | 78.34 |
| Previous Daily Low | 76.69 |
| Previous Weekly High | 82.61 |
| Previous Weekly Low | 76.69 |
| Previous Monthly High | 80.99 |
| Previous Monthly Low | 64.39 |
| Daily Fibonacci 38.2% | 77.71 |
| Daily Fibonacci 61.8% | 77.32 |
| Daily Pivot Point S1 | 76.96 |
| Daily Pivot Point S2 | 76.00 |
| Daily Pivot Point S3 | 75.31 |
| Daily Pivot Point R1 | 78.61 |
| Daily Pivot Point R2 | 79.30 |
| Daily Pivot Point R3 | 80.26 |
[/s2If]
Join Our Telegram Group
")


