#EURUSD @ 1.10509 Mixed manufacturing US economic data and falling US T-bond yields, a tailwind for the . (Pivot Orderbook analysis)
…
This is a premium post.
[s2If !current_user_can(access_s2member_level4)]Please register for FREE REGISTER to read full post below containing analysis. In case of any error or you think you are not able to read the full post below, please email us at support#nehcap.com [lwa][/s2If] [s2If current_user_can(access_s2member_level1)]
- Mixed manufacturing US economic data and falling US T-bond yields, a tailwind for the EUR/USD.
- Investors have almost entirely priced in a 25 bps rate hike by the Fed, as shown by the CME FedWatch Tool.
- ECB policymakers call for further tightening, considering a 25 or 50 bps hike at the May meeting.
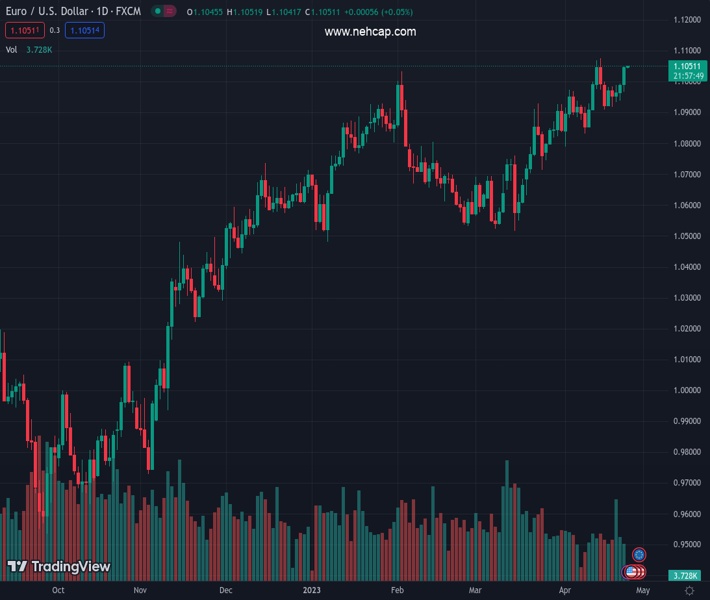
The pair currently trades last at 1.10509.
The previous day high was 1.0994 while the previous day low was 1.0938. The daily 38.2% Fib levels comes at 1.0972, expected to provide support. Similarly, the daily 61.8% fib level is at 1.0959, expected to provide support.
The Euro (EUR) finished Monday’s session positive, as the US Dollar (USD) weakened across the FX board, influenced by lower US Treasury bond yields. Manufacturing activity in the United States (US) showed mixed signs. Wall Street finished with losses as investors brace for next week’s US Federal Reserve Open Market Committee (FOMC) decision. The EUR/USD is trading at 1.1044, about to test the YTD high at around 1.1075.
As the Asian session begins, the EUR/USD is almost flat. The US economic docket featured the March Chicago Fed National Activity Index (CFNAI), which plummeted to -0.19, above estimates of -20, unchanged from February’s reading. The three-month moving average ticked up to 0.01%, indicating that the economy continues to expand slowly. Later, the April Dallas Fed Manufacturing Business Index slid to -23.4, well below the -11.00 estimated, as the survey showed that perceptions of broader business conditions worsened.
In the meantime, the CME FedWatch Tool foresees a 95.4% chance that the US Federal Reserve will hike rates to the 5.00%-5.25% range the following week.
US Treasury bond yields dropped, a headwind for the greenback, as shown by the US Dollar Index (DXY). The DXY is dropping 0.40%, down at 101.322, bolstering the Euro’s rally past the 1.1040 area.
Across the pond, European Central Bank (ECB) policymakers continued to cross newswires, with most expressing that further tightening is needed due to high inflation pressures. The ECB Governing Council member Isabel Schnabel commented that an increase of 50 bps at the May meeting is not off the table.
Data-wise, Germany’s IFO Business Climate Conditions and Expectations improved compared to March’s figures, spurring a jump in the EUR/USD pair towards the 1.1000 area.
Technical Levels: Supports and Resistances
EURUSD currently trading at 1.1049 at the time of writing. Pair opened at 1.0986 and is trading with a change of 0.57 % .
| Overview | Overview.1 | |
|---|---|---|
| 0 | Today last price | 1.1049 |
| 1 | Today Daily Change | 0.0063 |
| 2 | Today Daily Change % | 0.5700 |
| 3 | Today daily open | 1.0986 |
The pair remains strongly bullish on the daily timeframe. It trades above its 20 SMA @ 1.0921, 50 SMA 1.0767, 100 SMA @ 1.0736 and 200 SMA @ 1.0393.
| Trends | Trends.1 | |
|---|---|---|
| 0 | Daily SMA20 | 1.0921 |
| 1 | Daily SMA50 | 1.0767 |
| 2 | Daily SMA100 | 1.0736 |
| 3 | Daily SMA200 | 1.0393 |
The previous day high was 1.0994 while the previous day low was 1.0938. The daily 38.2% Fib levels comes at 1.0972, expected to provide support. Similarly, the daily 61.8% fib level is at 1.0959, expected to provide support.
Note the levels of interest below:
- Pivot support is noted at 1.0952, 1.0917, 1.0896
- Pivot resistance is noted at 1.1007, 1.1028, 1.1063
| Levels | Levels.1 |
|---|---|
| Previous Daily High | 1.0994 |
| Previous Daily Low | 1.0938 |
| Previous Weekly High | 1.1000 |
| Previous Weekly Low | 1.0909 |
| Previous Monthly High | 1.0930 |
| Previous Monthly Low | 1.0516 |
| Daily Fibonacci 38.2% | 1.0972 |
| Daily Fibonacci 61.8% | 1.0959 |
| Daily Pivot Point S1 | 1.0952 |
| Daily Pivot Point S2 | 1.0917 |
| Daily Pivot Point S3 | 1.0896 |
| Daily Pivot Point R1 | 1.1007 |
| Daily Pivot Point R2 | 1.1028 |
| Daily Pivot Point R3 | 1.1063 |
[/s2If]
Nehcap EA FIX downloadThe NEHCAP EA is high quality professional trading system geared to generate returns without using GRID or martingales.Each trade has strict risk per trade parameter. The pairs under management include EURUSD, GBPUSD, AUDCAD, AUDNZD,GBPAUD, EURAUD, EURCAD, CHFJPY and many more.The system is trading live: LIVE ACCOUNT TRACKING Apply for a free trial and track our account. Buy the system or use profit share mechanism to generate returns on your MT4.
Join Our Telegram Group
")


