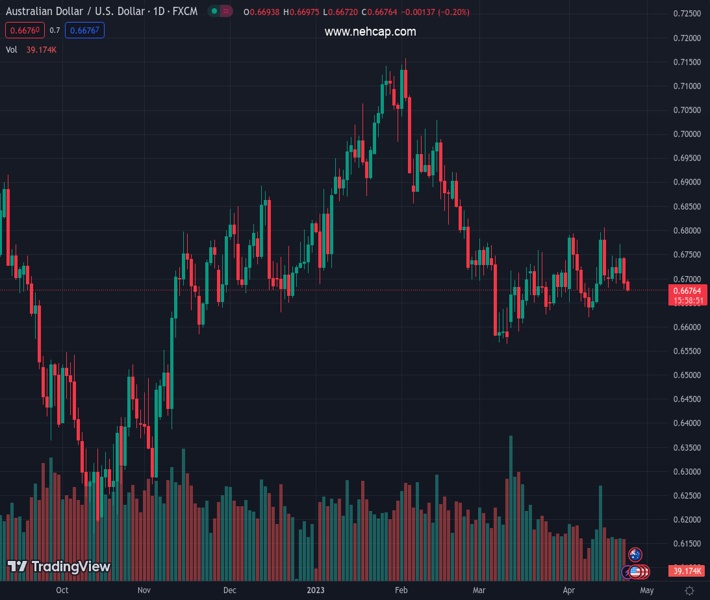
#AUDUSD @ 0.66761 remains under some selling pressure for the second successive day on Monday. (Pivot Orderbook analysis)
…
This is a premium post.
[s2If !current_user_can(access_s2member_level4)]Please register for PREMIUM VERSION HERE to read full post below containing analysis. In case of any error or you think you are not able to read the full post below, please email us at support#nehcap.com [lwa][/s2If] [s2If current_user_can(access_s2member_level4)]
- AUD/USD remains under some selling pressure for the second successive day on Monday.
- Bets for more rate hikes by the Fed help revive the USD demand and exert some pressure.
- A softer risk tone also benefits the safe-haven buck and weighs on the risk-sensitive Aussie.
The pair currently trades last at 0.66761.
The previous day high was 0.6754 while the previous day low was 0.6678. The daily 38.2% Fib levels comes at 0.6707, expected to provide resistance. Similarly, the daily 61.8% fib level is at 0.6725, expected to provide resistance.
The AUD/USD drifts lower for the second successive day on Monday and drops to a one-and-half-week low, around the 0.6675 region during the Asian session.
A combination of factors assists the US Dollar (USD) to gain some positive traction on the first day of the new week, which, in turn, is seen exerting downward pressure on the AUD/USD pair. The recent hawkish signals by several Federal Reserve (Fed) officials reaffirmed market bets for another 25 bps lift-off at the next FOMC meeting in May. Adding to this, the incoming US macro data suggested that the world’s largest economy remained resilient and supported prospects for further policy tightening by the Fed.
The flash version of the S&P Global’s PMI survey showed that the overall business activity in the US private sector expanded at a faster pace in April, with the Composite PMI rising from 52.3 in March to 53.5, or the highest since May last year. The upturn was led by the service sector, where activity grew for a third successive month and at the fastest rate for a year. Adding to this, the gauge for the US manufacturing sector moved in the expansion territory for the first time since October 2022, indicating growth momentum.
The data reinforced expectations that the Fed will continue lifting interest rates to curb inflation and fuels worries about economic headwinds stemming from rising borrowing costs. This, in turn, tempers investors’ appetite for riskier assets, which is evident from a generally weaker tone around the equity markets. The anti-risk flow is seen as another factor that benefits the Greenback’s relative safe-haven status and weighs on the risk-sensitive Aussie, suggesting that the path of least resistance for the AUD/USD pair is to the downside.
That said, the recent pullback in the US Treasury bond yields might hold back the USD bulls from placing aggressive bets. Apart from this, the hawkish tone from the Reserve Bank of Australia’s (RBA) April meeting minutes and the upbeat China macro data released last week should help limit losses for the AUD/USD pair. There isn’t any relevant market-moving economic data due for release from the US on Monday. Hence, traders will take cues from the broader risk sentiment to grab short-term opportunities around the pair.
Technical Levels: Supports and Resistances
AUDUSD currently trading at 0.6675 at the time of writing. Pair opened at 0.669 and is trading with a change of -0.22 % .
| Overview | Overview.1 | |
|---|---|---|
| 0 | Today last price | 0.6675 |
| 1 | Today Daily Change | -0.0015 |
| 2 | Today Daily Change % | -0.2200 |
| 3 | Today daily open | 0.6690 |
The pair remains strongly bearish on the daily time frame. It trades below the 20 SMA @ 0.6704, 50 SMA 0.6727, 100 SMA @ 0.6798 and 200 SMA @ 0.6743.
| Trends | Trends.1 | |
|---|---|---|
| 0 | Daily SMA20 | 0.6704 |
| 1 | Daily SMA50 | 0.6727 |
| 2 | Daily SMA100 | 0.6798 |
| 3 | Daily SMA200 | 0.6743 |
The previous day high was 0.6754 while the previous day low was 0.6678. The daily 38.2% Fib levels comes at 0.6707, expected to provide resistance. Similarly, the daily 61.8% fib level is at 0.6725, expected to provide resistance.
Note the levels of interest below:
- Pivot support is noted at 0.6661, 0.6631, 0.6585
- Pivot resistance is noted at 0.6737, 0.6783, 0.6812
| Levels | Levels.1 |
|---|---|
| Previous Daily High | 0.6754 |
| Previous Daily Low | 0.6678 |
| Previous Weekly High | 0.6772 |
| Previous Weekly Low | 0.6678 |
| Previous Monthly High | 0.6784 |
| Previous Monthly Low | 0.6564 |
| Daily Fibonacci 38.2% | 0.6707 |
| Daily Fibonacci 61.8% | 0.6725 |
| Daily Pivot Point S1 | 0.6661 |
| Daily Pivot Point S2 | 0.6631 |
| Daily Pivot Point S3 | 0.6585 |
| Daily Pivot Point R1 | 0.6737 |
| Daily Pivot Point R2 | 0.6783 |
| Daily Pivot Point R3 | 0.6812 |
[/s2If]
Join Our Telegram Group
")


