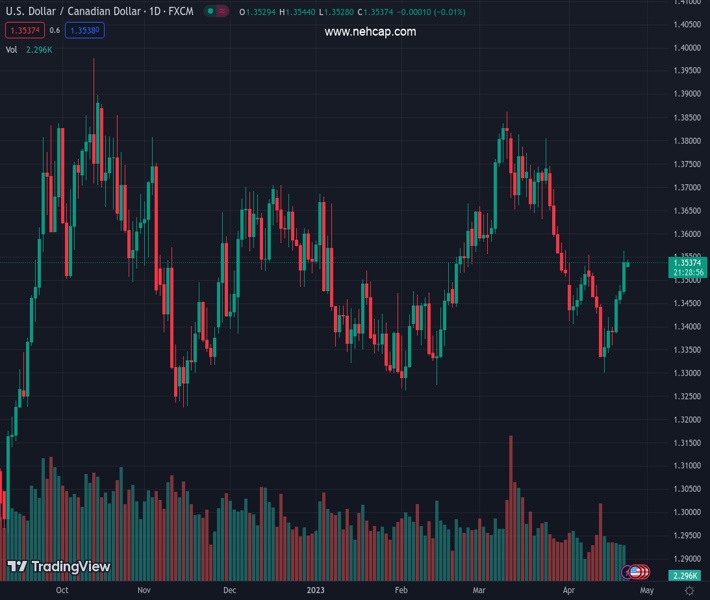
#USDCAD @ 1.35390 is building a base for a decisive break above 1.3550 despite downside bias for the US Dollar Index. (Pivot Orderbook analysis)
…
This is a premium post.
[s2If !current_user_can(access_s2member_level4)]Please register for PREMIUM VERSION HERE to read full post below containing analysis. In case of any error or you think you are not able to read the full post below, please email us at support#nehcap.com [lwa][/s2If] [s2If current_user_can(access_s2member_level4)]
- USD/CAD is building a base for a decisive break above 1.3550 despite downside bias for the US Dollar Index.
- Higher interest rates by the BoC have heavily impacted on Canada’s retail demand.
- The further downside in the oil price looks solid as global central banks are preparing for a fresh rate hike cycle.
The pair currently trades last at 1.35390.
The previous day high was 1.3563 while the previous day low was 1.3473. The daily 38.2% Fib levels comes at 1.3529, expected to provide support. Similarly, the daily 61.8% fib level is at 1.3507, expected to provide support.
The USD/CAD pair has turned sideways after a stellar north-side move around 1.3550 in the early Asian session. The Loonie asset is expected to extend its recovery sharply above the immediate resistance of 1.3550. The strength in the Loonie asset looks enormous despite a subdued performance by the US Dollar Index (DXY).
S&P500 futures are showing some losses in Asia as investors are worried about forthcoming quarterly results from the United States corporate, portraying a decline in the risk appetite of the market participants. The US Dollar Index (DXY) has dropped below 101.70 and is declining towards the four-day support of 101.63, showing strength in the downside momentum. The demand for US government bonds is getting sluggish as one more rate hike from the Federal Reserve (Fed) is widely expected. The 10-year US Treasury yields have scaled to near 3.57%.
The USD index has failed to capitalize on the upbeat preliminary United States S&P PMI data, released on Friday. S&P Manufacturing data jumped to 50.4 from the consensus of 49.0 and the former release of 49.2. The figure landed above 50.0 for the first time in the past six months, indicating economic recovery amid pessimist circumstances of higher interest rates from the Fed and tight conditions by US banks for consumers and business-type loans.
The Canadian Dollar has faced immense pressure due to Canada’s weak retail demand. February’s Retail Sales report showed that monthly Retail Sales contracted by 0.2% vs. an expectation of 0.6% contraction. Retail Sales ex-auto data contracted by 0.7% against a contraction of 0.1% as expected by the market participants. This shows a sheer impact on retail demand due to higher interest rates by the Bank of Canada (BoC). BoC Governor Tiff Macklem is expected to keep rates steady at elevated levels to bring down stubborn inflation.
On the oil front, oil prices are showing a sideways auction above $77.00. Further downside looks solid as global central banks are preparing for a fresh rate hike cycle, which would heavily impact oil demand. It is worth noting that Canada is the leading exporter of oil to the United States and lower oil prices will impact the Canadian Dollar.
Technical Levels: Supports and Resistances
USDCAD currently trading at 1.3536 at the time of writing. Pair opened at 1.354 and is trading with a change of -0.03 % .
| Overview | Overview.1 | |
|---|---|---|
| 0 | Today last price | 1.3536 |
| 1 | Today Daily Change | -0.0004 |
| 2 | Today Daily Change % | -0.0300 |
| 3 | Today daily open | 1.3540 |
The pair is trading above its 20 Daily moving average @ 1.348, below its 50 Daily moving average @ 1.3566 , above its 100 Daily moving average @ 1.3529 and above its 200 Daily moving average @ 1.3412
| Trends | Trends.1 | |
|---|---|---|
| 0 | Daily SMA20 | 1.3480 |
| 1 | Daily SMA50 | 1.3566 |
| 2 | Daily SMA100 | 1.3529 |
| 3 | Daily SMA200 | 1.3412 |
The previous day high was 1.3563 while the previous day low was 1.3473. The daily 38.2% Fib levels comes at 1.3529, expected to provide support. Similarly, the daily 61.8% fib level is at 1.3507, expected to provide support.
Note the levels of interest below:
- Pivot support is noted at 1.3487, 1.3435, 1.3397
- Pivot resistance is noted at 1.3578, 1.3616, 1.3668
| Levels | Levels.1 |
|---|---|
| Previous Daily High | 1.3563 |
| Previous Daily Low | 1.3473 |
| Previous Weekly High | 1.3563 |
| Previous Weekly Low | 1.3343 |
| Previous Monthly High | 1.3862 |
| Previous Monthly Low | 1.3508 |
| Daily Fibonacci 38.2% | 1.3529 |
| Daily Fibonacci 61.8% | 1.3507 |
| Daily Pivot Point S1 | 1.3487 |
| Daily Pivot Point S2 | 1.3435 |
| Daily Pivot Point S3 | 1.3397 |
| Daily Pivot Point R1 | 1.3578 |
| Daily Pivot Point R2 | 1.3616 |
| Daily Pivot Point R3 | 1.3668 |
[/s2If]
Join Our Telegram Group
")


