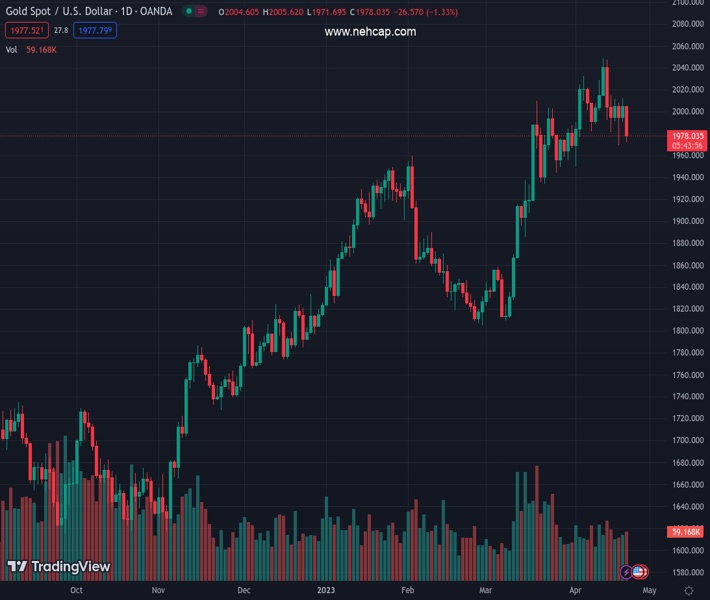
#XAUUSD @ 1,977.97 Gold price dives on a surprisingly positive US S&P Global PMIs. (Pivot Orderbook analysis)
…
This is a premium post.
[s2If !current_user_can(access_s2member_level4)]Please register for PREMIUM VERSION HERE to read full post below containing analysis. In case of any error or you think you are not able to read the full post below, please email us at support#nehcap.com [lwa][/s2If] [s2If current_user_can(access_s2member_level4)]
- Gold price dives on a surprisingly positive US S&P Global PMIs.
- Improvement in business activity in the US bolstered the US Dollar.
- The US Federal Reserve is expected to hike rates by 25 bps at the May meeting – FedWatch Tool.
The pair currently trades last at 1977.97.
The previous day high was 2012.44 while the previous day low was 1990.56. The daily 38.2% Fib levels comes at 2004.08, expected to provide resistance. Similarly, the daily 61.8% fib level is at 1998.92, expected to provide resistance.
Gold price plunges below $2,000 and hit a daily low of $1,971.74 after the release of economic data from the United States (US) showed that the economy continues to expand, despite recent reports flashing a recession. Therefore, XAU/USD is trading at $1,982.78, losses 1.07%, at the time of writing.
S&P Global reported the final PMI readings for the US, which surprised most investors, which were caught off guard, as shown by the market’s reaction. The S&P Global Manufacturing PMI was 50.4, above 49 estimates, while the Services rose to 53.7, exceeding the consensus of 51.5. Therefore, the Composite reading was 53.5, above its previous reading.
As a result, XAU/USD spiked to $1,997.95 before tanking toward a two-day low of $1971.30, $1.5 above the S3 daily pivot point and shy of testing the weekly low of $1,968.80. Conversely, US Treasury bond yields climbed, as the report signals that inflation could rise, with 2s and 10s, gaining each three basis points, at 4.184% and 3.564%, respectively.
In the meantime, the CME FedWatch Tool, which forecasts the next move of the US Federal Reserve (Fed), keeps odds at 88% for a 25 bps rate hike at the May 2-3 meeting. Hence, the greenback is pairing some of its Thursday’s losses, as shown by the US Dollar Index (DXY), which tracks the buck’s performance vs. six peers, up at 0.14% at 101.936.
On Thursday, Federal Reserve officials crossed newswires. Philadelphia Fed President Patrick Harker suggested the US central bank is close to ending its campaign to control inflation. At the same time, Cleveland’s Loretta Mester believes rates should go above 5% due to high inflation. The current benchmark rate is between 4.75% and 5%.
Next on the agenda, the Federal Reserve Governor Lisa Cook will cross newswires ahead of the media blackout that Fed officials would begin, ending with the Fed Chair Powell press conference on May 3.
From a technical perspective, Gold finally broke below the 20-day Exponential Moving Average (EMA) at 1988.01, which could pave the way for further downside. It should be said the 20-day EMA has been dynamic support for Gold buyers, meaning that sellers must keep prices below $1,988. If XAU/USD sellers want to cement their case, a break below the weekly low of $1,969.34 could keep them on the path toward the $1,950 area before testing the 50-day EMA at $1,944.87. Otherwise, XAU’s buyers, once reclaiming $1,990, could pave the way for a retest of $2,000.
Technical Levels: Supports and Resistances
XAUUSD currently trading at 1978.93 at the time of writing. Pair opened at 2004.8 and is trading with a change of -1.29 % .
| Overview | Overview.1 | |
|---|---|---|
| 0 | Today last price | 1978.93 |
| 1 | Today Daily Change | -25.87 |
| 2 | Today Daily Change % | -1.29 |
| 3 | Today daily open | 2004.80 |
The pair is trading below its 20 Daily moving average @ 1995.18, above its 50 Daily moving average @ 1917.47 , above its 100 Daily moving average @ 1885.31 and above its 200 Daily moving average @ 1799.01
| Trends | Trends.1 | |
|---|---|---|
| 0 | Daily SMA20 | 1995.18 |
| 1 | Daily SMA50 | 1917.47 |
| 2 | Daily SMA100 | 1885.31 |
| 3 | Daily SMA200 | 1799.01 |
The previous day high was 2012.44 while the previous day low was 1990.56. The daily 38.2% Fib levels comes at 2004.08, expected to provide resistance. Similarly, the daily 61.8% fib level is at 1998.92, expected to provide resistance.
Note the levels of interest below:
- Pivot support is noted at 1992.76, 1980.72, 1970.88
- Pivot resistance is noted at 2014.64, 2024.48, 2036.52
| Levels | Levels.1 |
|---|---|
| Previous Daily High | 2012.44 |
| Previous Daily Low | 1990.56 |
| Previous Weekly High | 2048.75 |
| Previous Weekly Low | 1986.28 |
| Previous Monthly High | 2009.88 |
| Previous Monthly Low | 1809.46 |
| Daily Fibonacci 38.2% | 2004.08 |
| Daily Fibonacci 61.8% | 1998.92 |
| Daily Pivot Point S1 | 1992.76 |
| Daily Pivot Point S2 | 1980.72 |
| Daily Pivot Point S3 | 1970.88 |
| Daily Pivot Point R1 | 2014.64 |
| Daily Pivot Point R2 | 2024.48 |
| Daily Pivot Point R3 | 2036.52 |
[/s2If]
Join Our Telegram Group
")


