#XAGUSD @ 25.064 Silver price retreats after hitting daily high on upbeat US economic data. (Pivot Orderbook analysis)
…
This is a premium post.
[s2If !current_user_can(access_s2member_level4)]Please register for PREMIUM VERSION HERE to read full post below containing analysis. In case of any error or you think you are not able to read the full post below, please email us at support#nehcap.com [lwa][/s2If] [s2If current_user_can(access_s2member_level4)]
- Silver price retreats after hitting daily high on upbeat US economic data.
- Upward momentum for XAG/USD remains despite recent losses.
- XAG/USD may drop unless it holds above a critical support level.
The pair currently trades last at 25.064.
The previous day high was 25.5 while the previous day low was 25.06. The daily 38.2% Fib levels comes at 25.33, expected to provide resistance. Similarly, the daily 61.8% fib level is at 25.23, expected to provide resistance.
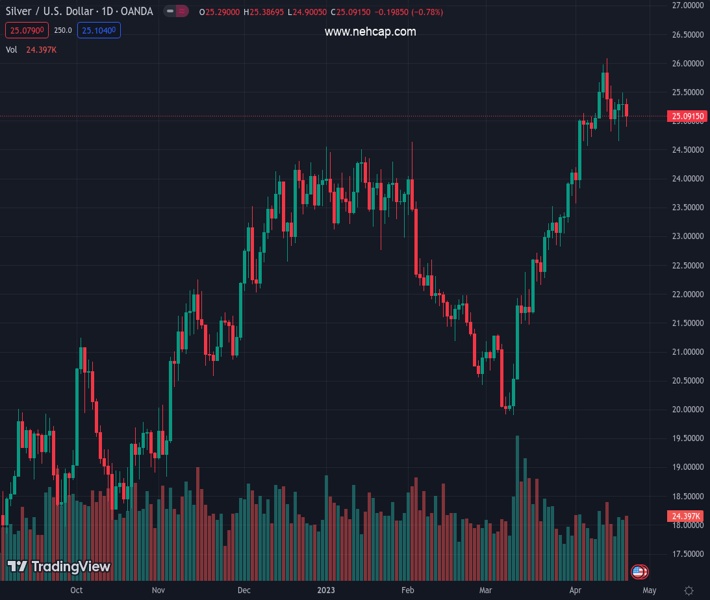
Silver price retraces after hitting a daily high of $25.37, last seen at around $25.05, as US Treasury bond yields edged up, following upbeat US economic data. At the time of writing, the XAG/USD is trading at $25.05, down 0.83%.
XAG/USD remains upward biased, although it posted back-to-back days of losses, led by Thursday’s price action, which printed a doji, followed by a bearish candlestick, about to close below the April 20 low of $25.06. However, the uptrend remains in play unless the XAG/USD drops below the confluence of the April 19 low and the 20-day EMA around $25.58/65.
If XAG/USD clears April’s 20 high at $25.49, it could exacerbate a rally to the YTD high of $26.08. A breach of the latter will expose the last year’s high at $26.95, shy of the $27.00 figure.
Conversely, the XAG/USD could test February’s 2 high-turned-support at $24.63, immediately followed by the 20-day EMA. If the Relative Strength Index (RSI) continues to drop, as it has done since six-days ago, a test of the $24.00 figure is on the cards. Downside risks remain eyed at the 50-day EMA at
Technical Levels: Supports and Resistances
XAGUSD currently trading at 25.1 at the time of writing. Pair opened at 25.29 and is trading with a change of -0.75 % .
| Overview | Overview.1 | |
|---|---|---|
| 0 | Today last price | 25.10 |
| 1 | Today Daily Change | -0.19 |
| 2 | Today Daily Change % | -0.75 |
| 3 | Today daily open | 25.29 |
The pair remains strongly bullish on the daily timeframe. It trades above its 20 SMA @ 24.52, 50 SMA 22.69, 100 SMA @ 23.08 and 200 SMA @ 21.38.
| Trends | Trends.1 | |
|---|---|---|
| 0 | Daily SMA20 | 24.52 |
| 1 | Daily SMA50 | 22.69 |
| 2 | Daily SMA100 | 23.08 |
| 3 | Daily SMA200 | 21.38 |
The previous day high was 25.5 while the previous day low was 25.06. The daily 38.2% Fib levels comes at 25.33, expected to provide resistance. Similarly, the daily 61.8% fib level is at 25.23, expected to provide resistance.
Note the levels of interest below:
- Pivot support is noted at 25.07, 24.84, 24.63
- Pivot resistance is noted at 25.51, 25.72, 25.95
| Levels | Levels.1 |
|---|---|
| Previous Daily High | 25.50 |
| Previous Daily Low | 25.06 |
| Previous Weekly High | 26.09 |
| Previous Weekly Low | 24.72 |
| Previous Monthly High | 24.16 |
| Previous Monthly Low | 19.90 |
| Daily Fibonacci 38.2% | 25.33 |
| Daily Fibonacci 61.8% | 25.23 |
| Daily Pivot Point S1 | 25.07 |
| Daily Pivot Point S2 | 24.84 |
| Daily Pivot Point S3 | 24.63 |
| Daily Pivot Point R1 | 25.51 |
| Daily Pivot Point R2 | 25.72 |
| Daily Pivot Point R3 | 25.95 |
[/s2If]
Join Our Telegram Group
")


