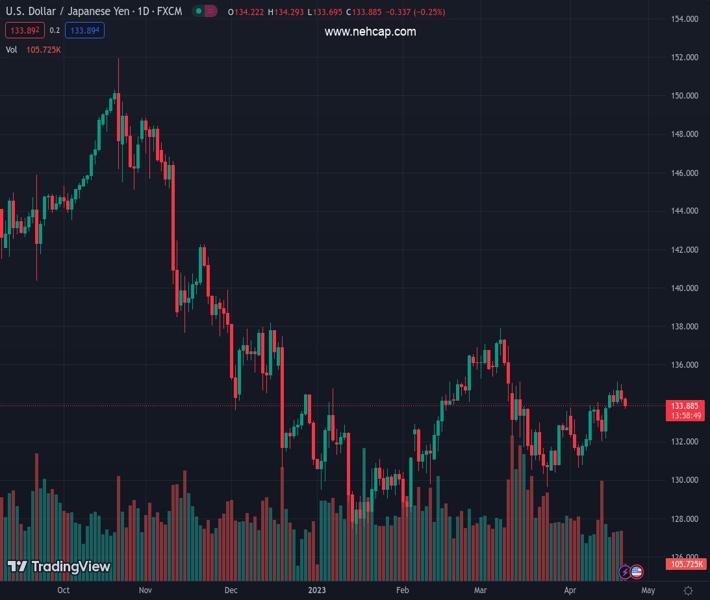
#USDJPY @ 133.870 remains under heavy selling pressure for the second successive day on Friday. (Pivot Orderbook analysis)
…
This is a premium post.
[s2If !current_user_can(access_s2member_level4)]Please register for PREMIUM VERSION HERE to read full post below containing analysis. In case of any error or you think you are not able to read the full post below, please email us at support#nehcap.com [lwa][/s2If] [s2If current_user_can(access_s2member_level4)]
- USD/JPY remains under heavy selling pressure for the second successive day on Friday.
- Stronger inflation figures from Japan and a softer risk tone benefit the safe-haven JPY.
- Bets for more Fed rate hikes act as a tailwind for the USD and could limit further losses.
The pair currently trades last at 133.870.
The previous day high was 134.97 while the previous day low was 134.01. The daily 38.2% Fib levels comes at 134.38, expected to provide resistance. Similarly, the daily 61.8% fib level is at 134.61, expected to provide resistance.
The USD/JPY pair drifts lower for the second successive day on Friday and drops to a four-day low, around the 133.70 region during the early part of the European session.
A combination of factors provides a goodish lift to the Japanese Yen (JPY), which, in turn, drags the USD/JPY pair away from a multi-week high, around the 135.10-135.15 region touched on Wednesday. According to the data released earlier this Friday, Japan’s National Consumer Price Index (CPI) ticked down to a 3.2% YoY rate in March from 3.3% previous. This, however, was well above the 2.6% estimated and the Bank of Japan’s target range. Furthermore, the Core CPI, which excludes volatile oil and food prices, accelerated to a 3.8% YoY rate from 3.5% in February, surpassing expectations for a reading of 3.4%. This, in turn, indicates broadening price pressure in the world’s third-largest economy and keeps alive expectations that the BoJ could begin to phase out its massive stimulus programme later this year.
Apart from this, a generally weaker tone around the equity markets benefits the JPY’s relative safe-haven status and contributes to the offered tone surrounding the USD/JPY pair. Investors remain worried about economic headwinds stemming from rising borrowing costs, which, in turn, take its toll on the global risk sentiment. Meanwhile, the flight to safety leads to a further slide in the US Treasury bond yields, resulting in the narrowing of the US-Japan rate differential and lending additional support to the JPY. That said, growing acceptance that the Federal Reserve (Fed) will continue raising interest rates acts as a tailwind for the US Dollar (USD) and could help limit the downside for the major. This, in turn, warrants some caution for aggressive bearish trades and before positioning for any meaningful intraday fall.
Traders now look forward to the release of the flash PMI prints from the US, due later during the early North American session. This, along with the US bond yields, will influence the USD price dynamics and provide some impetus to the USD/JPY pair. Apart from this, the broader risk sentiment will drive demand for the safe-haven JPY and contribute to producing short-term trading opportunities on the last day of the week.
Technical Levels: Supports and Resistances
USDJPY currently trading at 133.83 at the time of writing. Pair opened at 134.24 and is trading with a change of -0.31 % .
| Overview | Overview.1 | |
|---|---|---|
| 0 | Today last price | 133.83 |
| 1 | Today Daily Change | -0.41 |
| 2 | Today Daily Change % | -0.31 |
| 3 | Today daily open | 134.24 |
The pair is trading above its 20 Daily moving average @ 132.76, above its 50 Daily moving average @ 133.69 , above its 100 Daily moving average @ 133.01 and below its 200 Daily moving average @ 137.09
| Trends | Trends.1 | |
|---|---|---|
| 0 | Daily SMA20 | 132.76 |
| 1 | Daily SMA50 | 133.69 |
| 2 | Daily SMA100 | 133.01 |
| 3 | Daily SMA200 | 137.09 |
The previous day high was 134.97 while the previous day low was 134.01. The daily 38.2% Fib levels comes at 134.38, expected to provide resistance. Similarly, the daily 61.8% fib level is at 134.61, expected to provide resistance.
Note the levels of interest below:
- Pivot support is noted at 133.84, 133.45, 132.88
- Pivot resistance is noted at 134.8, 135.37, 135.76
| Levels | Levels.1 |
|---|---|
| Previous Daily High | 134.97 |
| Previous Daily Low | 134.01 |
| Previous Weekly High | 134.04 |
| Previous Weekly Low | 131.83 |
| Previous Monthly High | 137.91 |
| Previous Monthly Low | 129.64 |
| Daily Fibonacci 38.2% | 134.38 |
| Daily Fibonacci 61.8% | 134.61 |
| Daily Pivot Point S1 | 133.84 |
| Daily Pivot Point S2 | 133.45 |
| Daily Pivot Point S3 | 132.88 |
| Daily Pivot Point R1 | 134.80 |
| Daily Pivot Point R2 | 135.37 |
| Daily Pivot Point R3 | 135.76 |
[/s2If]
Join Our Telegram Group
")


