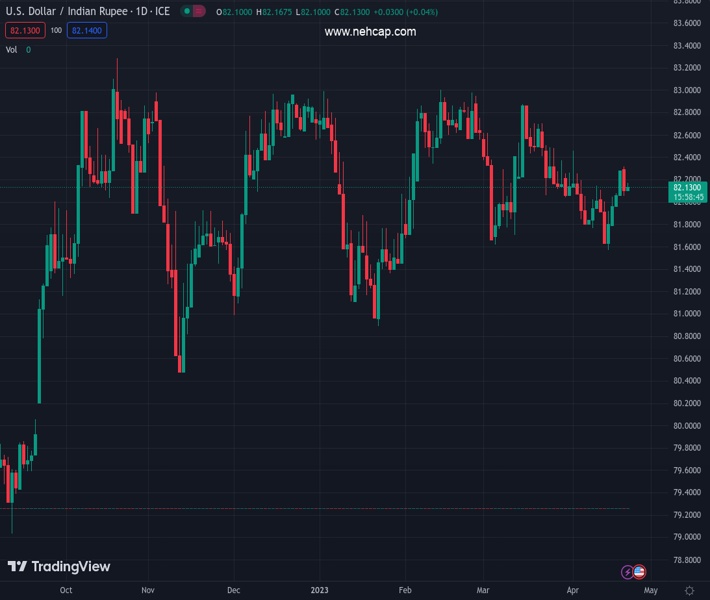
#USDINR @ 82.1370 is seen oscillating in a narrow trading band above the 82.00 round figure. (Pivot Orderbook analysis)
…
This is a premium post.
[s2If !current_user_can(access_s2member_level4)]Please register for PREMIUM VERSION HERE to read full post below containing analysis. In case of any error or you think you are not able to read the full post below, please email us at support#nehcap.com [lwa][/s2If] [s2If current_user_can(access_s2member_level4)]
- USD/INR is seen oscillating in a narrow trading band above the 82.00 round figure.
- Neutral technical indicators on the daily chart hold back traders from placing bets.
- Any meaningful slide could be seen as a buying opportunity near the 200-day SMA.
The pair currently trades last at 82.1370.
The previous day high was 82.4176 while the previous day low was 82.0505. The daily 38.2% Fib levels comes at 82.1907, expected to provide resistance. Similarly, the daily 61.8% fib level is at 82.2773, expected to provide resistance.
The USD/INR pair struggles to gain any meaningful traction on Friday and oscillates in a narrow trading band above the 82.00 mark heading into the European session.
From a technical perspective, neutral oscillators on the daily chart haven’t been supportive of any firm near-term direction. This, in turn, holds back traders from placing aggressive bets and leads to subdued price action on the last day of the week. The USD/INR pair, however, has managed to hold its neck above the 81.50 horizontal support. The said area now coincides with the very important 200-day Simple Moving Average (SMA) and should act as a pivotal point.
A convincing breakdown through the aforementioned support will be seen as a fresh trigger for bearish traders and pave the way for deeper losses. The USD/INR might then accelerate the fall towards testing the 81.00 round-figure mark. The downward trajectory could get extended further towards the next relevant support near the 81.40-81.30 region, which if broken decisively will confirm that spot prices have topped out and set the stage for a further depreciating move.
On the flip side, the monthly swing high, around the 82.50 level, might now act as an immediate hurdle, above which a bout of a short-covering move should allow the USD/INR pair to make a fresh attempt to conquer the 83.00 mark. Some follow-through buying beyond the 83.20-83.30 supply zone, or the all-time peak, will mark a fresh bullish breakout and prompt aggressive technical buying, paving the way for a move towards reclaiming the 84.00 round-figure mark.
Technical Levels: Supports and Resistances
USDINR currently trading at 82.154 at the time of writing. Pair opened at 82.1482 and is trading with a change of 0.01 % .
| Overview | Overview.1 | |
|---|---|---|
| 0 | Today last price | 82.1540 |
| 1 | Today Daily Change | 0.0058 |
| 2 | Today Daily Change % | 0.0100 |
| 3 | Today daily open | 82.1482 |
The pair is trading above its 20 Daily moving average @ 82.0633, below its 50 Daily moving average @ 82.3161 , below its 100 Daily moving average @ 82.2475 and above its 200 Daily moving average @ 81.5139
| Trends | Trends.1 | |
|---|---|---|
| 0 | Daily SMA20 | 82.0633 |
| 1 | Daily SMA50 | 82.3161 |
| 2 | Daily SMA100 | 82.2475 |
| 3 | Daily SMA200 | 81.5139 |
The previous day high was 82.4176 while the previous day low was 82.0505. The daily 38.2% Fib levels comes at 82.1907, expected to provide resistance. Similarly, the daily 61.8% fib level is at 82.2773, expected to provide resistance.
Note the levels of interest below:
- Pivot support is noted at 81.9933, 81.8384, 81.6262
- Pivot resistance is noted at 82.3603, 82.5725, 82.7274
| Levels | Levels.1 |
|---|---|
| Previous Daily High | 82.4176 |
| Previous Daily Low | 82.0505 |
| Previous Weekly High | 82.1600 |
| Previous Weekly Low | 81.5105 |
| Previous Monthly High | 83.0315 |
| Previous Monthly Low | 81.5120 |
| Daily Fibonacci 38.2% | 82.1907 |
| Daily Fibonacci 61.8% | 82.2773 |
| Daily Pivot Point S1 | 81.9933 |
| Daily Pivot Point S2 | 81.8384 |
| Daily Pivot Point S3 | 81.6262 |
| Daily Pivot Point R1 | 82.3603 |
| Daily Pivot Point R2 | 82.5725 |
| Daily Pivot Point R3 | 82.7274 |
[/s2If]
Join Our Telegram Group
")


