#NZDUSD @ 0.61700 is expected to witness a downside after the conclusion of the short-lived pullback to near 0.6170. (Pivot Orderbook analysis)
…
This is a premium post.
[s2If !current_user_can(access_s2member_level4)]Please register for PREMIUM VERSION HERE to read full post below containing analysis. In case of any error or you think you are not able to read the full post below, please email us at support#nehcap.com [lwa][/s2If] [s2If current_user_can(access_s2member_level4)]
- NZD/USD is expected to witness a downside after the conclusion of the short-lived pullback to near 0.6170.
- Fed policymakers are supporting more conservative monetary policy despite easing US labor market conditions.
- A significant decline in NZ inflation indicates that the RBNZ is well on track of arresting sticky inflation.
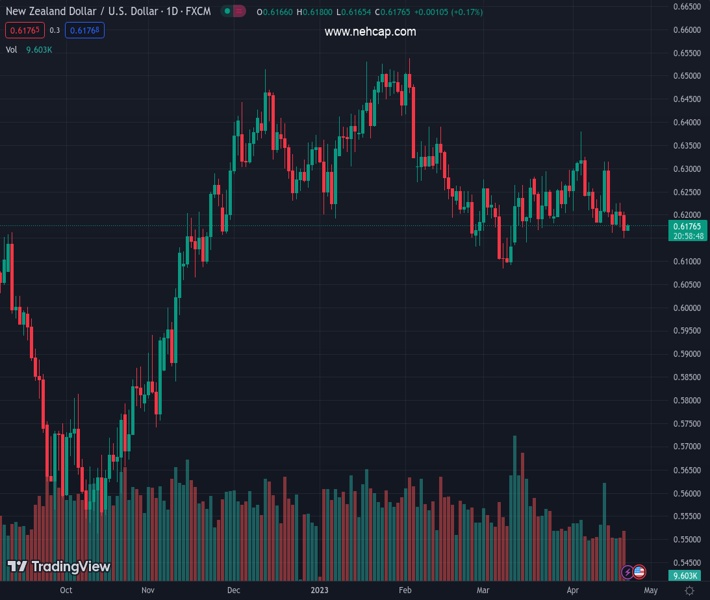
The pair currently trades last at 0.61700.
The previous day high was 0.6227 while the previous day low was 0.6172. The daily 38.2% Fib levels comes at 0.6193, expected to provide resistance. Similarly, the daily 61.8% fib level is at 0.6206, expected to provide resistance.
The NZD/USD pair is hovering above 0.6170 in the early Asian session after a less-confident recovery move from 0.6150. The Kiwi asset is expected to resume its downside journey below 0.6150 as Federal Reserve (Fed) policymakers are supporting more conservative monetary policy from the central bank despite easing United States labor market conditions.
S&P500 futures are showing nominal gains in the Asian session after three consecutive bearish settlements, indicating that the overall market sentiment is quite negative. US equities faced extreme pressure on Thursday as investors showed dissatisfaction with the price-cutting spree by Electric Vehicle (EV) maker Tesla.
The US Dollar Index (DXY) has been muted after a volatile session on Thursday ahead of the release of the preliminary US S&P PMI data. As per the consensus, the Manufacturing PMI will land at 49.0, lower than the former release of 49.2. The Services PMI is also seen lower at 51.5 against the figure of 52.6 released earlier. A contraction in economic activities indicates a decline in the overall demand, which would cement the expectations of a slowdown ahead.
US weekly jobless claims data, released on Thursday, supported the view of easing labor market conditions. The Department of Labor showed a jump in jobless claims for the week ending April 14 at 245K higher than the consensus of 240K.
Meanwhile, Fed policymakers are still confident of one more rate hike ahead. St. Louis Fed President James Bullard advocated for the continuation of a policy-tightening spell by the central bank considering the fact that labor market data is still solid, as reported by Reuters. Fed policymaker further added that demand for labor has not softened yet and a strong labor market leads to strong consumption.
The New Zealand Dollar remained in action on Thursday after the release of lower-than-anticipated inflation data. In the first quarter, inflationary pressures accelerated by 1.2% vs. the consensus of 1.7% and the former release of 1.4%. Annual inflation softened to 6.7% while the street was anticipating a marginal deceleration to 7.1% from the prior release of 7.2%.
A significant decline in Kiwi inflation indicates that the Reserve Bank of New Zealand (RBNZ) is on the right track to arresting stick inflation. Investors should be aware of the fact that RBNZ Governor Adrian Orr raised interest rates surprisingly by 50 basis points (bps) to 5.25% in its last monetary policy meeting held on April 05.
Technical Levels: Supports and Resistances
NZDUSD currently trading at 0.6177 at the time of writing. Pair opened at 0.62 and is trading with a change of -0.37 % .
| Overview | Overview.1 | |
|---|---|---|
| 0 | Today last price | 0.6177 |
| 1 | Today Daily Change | -0.0023 |
| 2 | Today Daily Change % | -0.3700 |
| 3 | Today daily open | 0.6200 |
The pair is trading below its 20 Daily moving average @ 0.6241, below its 50 Daily moving average @ 0.623 , below its 100 Daily moving average @ 0.6303 and above its 200 Daily moving average @ 0.6163
| Trends | Trends.1 | |
|---|---|---|
| 0 | Daily SMA20 | 0.6241 |
| 1 | Daily SMA50 | 0.6230 |
| 2 | Daily SMA100 | 0.6303 |
| 3 | Daily SMA200 | 0.6163 |
The previous day high was 0.6227 while the previous day low was 0.6172. The daily 38.2% Fib levels comes at 0.6193, expected to provide resistance. Similarly, the daily 61.8% fib level is at 0.6206, expected to provide resistance.
Note the levels of interest below:
- Pivot support is noted at 0.6173, 0.6145, 0.6118
- Pivot resistance is noted at 0.6228, 0.6255, 0.6283
| Levels | Levels.1 |
|---|---|
| Previous Daily High | 0.6227 |
| Previous Daily Low | 0.6172 |
| Previous Weekly High | 0.6316 |
| Previous Weekly Low | 0.6169 |
| Previous Monthly High | 0.6298 |
| Previous Monthly Low | 0.6084 |
| Daily Fibonacci 38.2% | 0.6193 |
| Daily Fibonacci 61.8% | 0.6206 |
| Daily Pivot Point S1 | 0.6173 |
| Daily Pivot Point S2 | 0.6145 |
| Daily Pivot Point S3 | 0.6118 |
| Daily Pivot Point R1 | 0.6228 |
| Daily Pivot Point R2 | 0.6255 |
| Daily Pivot Point R3 | 0.6283 |
[/s2If]
Join Our Telegram Group
")


