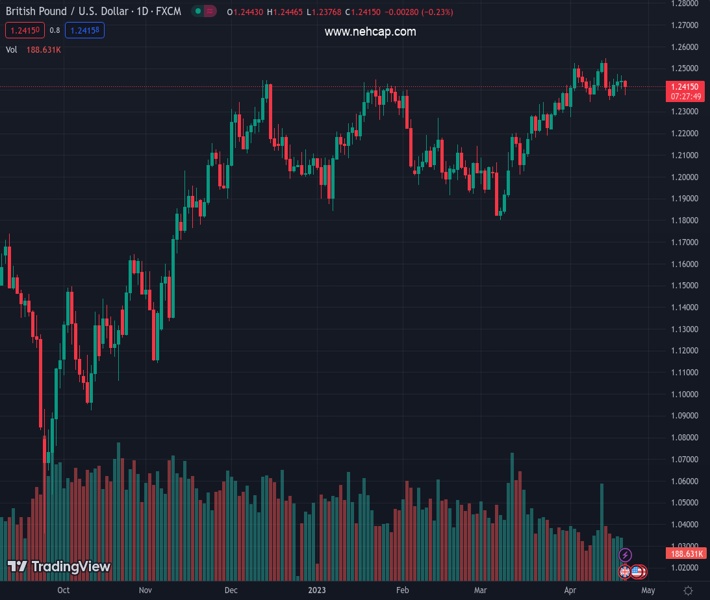
#GBPUSD @ 1.24490 comes under some selling pressure on Friday, albeit the fall lacks bearish conviction. (Pivot Orderbook analysis)
…
This is a premium post.
[s2If !current_user_can(access_s2member_level4)]Please register for PREMIUM VERSION HERE to read full post below containing analysis. In case of any error or you think you are not able to read the full post below, please email us at support#nehcap.com [lwa][/s2If] [s2If current_user_can(access_s2member_level4)]
- GBP/USD comes under some selling pressure on Friday, albeit the fall lacks bearish conviction.
- The disappointing UK Retail Sales data, mixed UK PMIs undermine the GBP and exert pressure.
- Retreating US bond yields keeps a lid on the intraday USD uptick and lends support to the pair.
The pair currently trades last at 1.24490.
The previous day high was 1.2468 while the previous day low was 1.2405. The daily 38.2% Fib levels comes at 1.2444, expected to provide support. Similarly, the daily 61.8% fib level is at 1.2429, expected to provide support.
The GBP/USD pair stalls its intraday decline near the 1.2375 region and recovers over 40 pips from a three-day low touched earlier this Friday. Spot prices, however, keep the red through the early North American session and currently trade around the 1.2415-1.2420 area, still down nearly 0.20% for the day.
The British Pound weakens across the board following the disappointing UK macro releases, which, along with an intraday US Dollar (USD) uptick, exert some downward pressure on the GBP/USD pair. In fact, the UK Office for National Statistics reported that domestic Retail Sales contracted by 0.9% in March and sales excluding fuel dropped by 1% during the reported month, both missing consensus estimates. Adding to this, the flash UK Manufacturing PMI delivers a negative surprise and drops further into contraction territory, to 46.6 in April, offsetting the better-than-expected Services PMI, which rose to 54.9 in April.
The USD, on the other hand, initially drew support from growing acceptance that the Federal Reserve (Fed) will continue raising interest rates. This was seen as another factor weighing on the GBP/USD pair, though the intraday downfall stalls ahead of the 1.2350 strong horizontal support. The ongoing downfall in the US Treasury bond yields, along with a modest recovery in the global risk sentiment, act as a headwind for the safe-haven Greenback. Apart from this, rising bets for an additional interest rate hike by the Bank of England (BoE) in May contribute to limiting losses for the major, at least for the time being.
The aforementioned mixed fundamental backdrop warrants some caution for aggressive traders and before positioning for a firm near-term direction. Market participants now look forward to the release of the flash US PMI prints. This, along with the US bond yields and the broader risk sentiment, will influence the USD price dynamics and allow traders to grab short-term opportunities around the GBP/USD pair.
Technical Levels: Supports and Resistances
GBPUSD currently trading at 1.2419 at the time of writing. Pair opened at 1.2443 and is trading with a change of -0.19 % .
| Overview | Overview.1 | |
|---|---|---|
| 0 | Today last price | 1.2419 |
| 1 | Today Daily Change | -0.0024 |
| 2 | Today Daily Change % | -0.1900 |
| 3 | Today daily open | 1.2443 |
The pair remains strongly bullish on the daily timeframe. It trades above its 20 SMA @ 1.2402, 50 SMA 1.2202, 100 SMA @ 1.2196 and 200 SMA @ 1.1924.
| Trends | Trends.1 | |
|---|---|---|
| 0 | Daily SMA20 | 1.2402 |
| 1 | Daily SMA50 | 1.2202 |
| 2 | Daily SMA100 | 1.2196 |
| 3 | Daily SMA200 | 1.1924 |
The previous day high was 1.2468 while the previous day low was 1.2405. The daily 38.2% Fib levels comes at 1.2444, expected to provide support. Similarly, the daily 61.8% fib level is at 1.2429, expected to provide support.
Note the levels of interest below:
- Pivot support is noted at 1.2409, 1.2375, 1.2346
- Pivot resistance is noted at 1.2473, 1.2502, 1.2536
| Levels | Levels.1 |
|---|---|
| Previous Daily High | 1.2468 |
| Previous Daily Low | 1.2405 |
| Previous Weekly High | 1.2546 |
| Previous Weekly Low | 1.2344 |
| Previous Monthly High | 1.2424 |
| Previous Monthly Low | 1.1803 |
| Daily Fibonacci 38.2% | 1.2444 |
| Daily Fibonacci 61.8% | 1.2429 |
| Daily Pivot Point S1 | 1.2409 |
| Daily Pivot Point S2 | 1.2375 |
| Daily Pivot Point S3 | 1.2346 |
| Daily Pivot Point R1 | 1.2473 |
| Daily Pivot Point R2 | 1.2502 |
| Daily Pivot Point R3 | 1.2536 |
[/s2If]
Join Our Telegram Group
")


