#EURUSD @ 1.09870 S&P Global PMI figures ease recessionary fears, boost US economy. (Pivot Orderbook analysis)
…
This is a premium post.
[s2If !current_user_can(access_s2member_level4)]Please register for PREMIUM VERSION HERE to read full post below containing analysis. In case of any error or you think you are not able to read the full post below, please email us at support#nehcap.com [lwa][/s2If] [s2If current_user_can(access_s2member_level4)]
- S&P Global PMI figures ease recessionary fears, boost US economy.
- Traders’ moods fluctuating to risk-on/off dominated the New York session.
- EU’s PMI results are mixed; manufacturing activity shranks, while Services and Composite Indices exceed expectations.
- Markets remain cautious amid uncertain rate outlooks from the Fed and the ECB.
The pair currently trades last at 1.09870.
The previous day high was 1.099 while the previous day low was 1.0934. The daily 38.2% Fib levels comes at 1.0968, expected to provide support. Similarly, the daily 61.8% fib level is at 1.0955, expected to provide support.
The EUR/USD prepares to finish the week on a higher note, though it remains below the 1.1000 figure, albeit economic data from the United States (US) bolstered the US Dollar (USD). However, late into the Wall Street close, the greenback lost strength, US equities rose, and the Euro (EUR) recovered some ground. Hence, the EUR/USD is trading at 1.0988 after reaching a low of 1.0937.
Sentiment across the New York (NY) session fluctuated between risk-on/off. Investors’ recessionary fears about the US were pushed away by April’s S&P Global PMI figures, which showed the economy’s resilience, despite the US Federal Reserve (Fed) 475 bps of tightening. Manufacturing and Services PMIs exceeded estimates, with the former at 50.4, above 49 expectations, while the latter jumped to 53.7 from 51.5 estimates. Therefore, the Composite Index aimed higher to 53.5.
The market initially reacted to buying the US Dollar, which gained some ground vs. the Euro, as it dived to 1.0942. Nevertheless, buyers moved in and lifted the EUR/USD pair, though they failed to crack the 1.1000 mark.
This happened after Thursday’s data, namely, US unemployment claims, housing data, and the Philadelphia Fed Manufacturing Index, flashed a gloomy scenario, triggering flows towards safety, except for the US Dollar.
Aside from this, on the Eurozone (EU) side, Thursday’s calendar featured a surplus in the Balance of Trader of €4.6B, better than January’s deficit of €-31.6B, which was upward revised, alongside the Consumer Confidence, which improved a tick, to -17.5 above -18.5 estimates.
On Friday, the EU’s PMI was mixed, with the Manufacturing Index at 45.5, standing at contractionary territory missing estimates, while the Services and Composite Indices exceeded the consensus, expanding.
Meanwhile, central bankers from both sides of the Atlantic continued their hawkish rhetoric. For one part, Federal Reserve (Fed) officials agreed that inflation is too high, though there’s a myriad of opinions regarding how much tightening is left. On the European Central Bank (ECB), the baseline was made by its ECB Chief Economist Philip Lane, with most policymakers yet undecided about lifting rates by 50 or 25 bps.
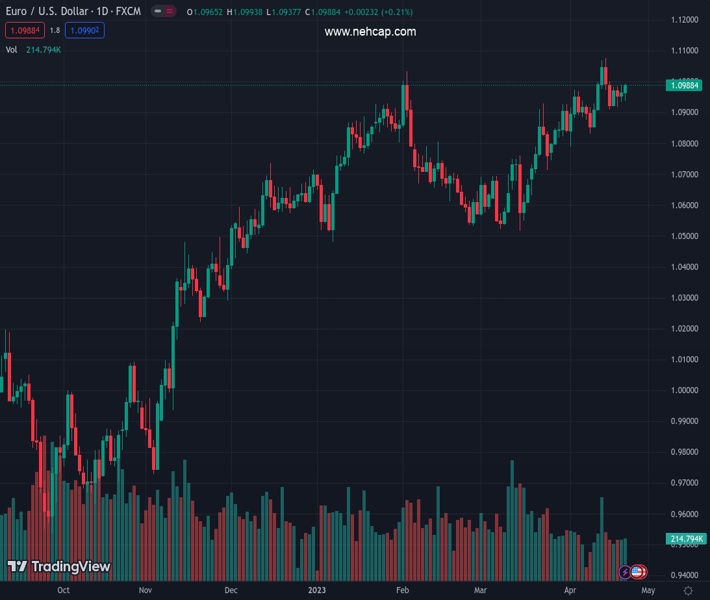
From a daily chart perspective, the EUR/USD remains supported by the 20-day EMA from March 20 until today. Yet EUR/USD tested the April 21, 2022 high-turned-support at 1.0936, bounced off, and clung to the 1.0980s area amidst the lack of an impactful catalyst that could break the EUR/USD’s trading range. Should the EUR/USD reclaim 1.1000, a test to the YTD high is on the cards, followed by 1.1100. Conversely, a fall below 1.0900 will expose the 20-day EMA at 1.0911. If EUR/USD drops below the latter, a dive to 1.0800 is likely.
Technical Levels: Supports and Resistances
EURUSD currently trading at 1.0986 at the time of writing. Pair opened at 1.097 and is trading with a change of 0.15 % .
| Overview | Overview.1 | |
|---|---|---|
| 0 | Today last price | 1.0986 |
| 1 | Today Daily Change | 0.0016 |
| 2 | Today Daily Change % | 0.1500 |
| 3 | Today daily open | 1.0970 |
The pair remains strongly bullish on the daily timeframe. It trades above its 20 SMA @ 1.091, 50 SMA 1.0761, 100 SMA @ 1.0732 and 200 SMA @ 1.0389.
| Trends | Trends.1 | |
|---|---|---|
| 0 | Daily SMA20 | 1.0910 |
| 1 | Daily SMA50 | 1.0761 |
| 2 | Daily SMA100 | 1.0732 |
| 3 | Daily SMA200 | 1.0389 |
The previous day high was 1.099 while the previous day low was 1.0934. The daily 38.2% Fib levels comes at 1.0968, expected to provide support. Similarly, the daily 61.8% fib level is at 1.0955, expected to provide support.
Note the levels of interest below:
- Pivot support is noted at 1.0939, 1.0908, 1.0883
- Pivot resistance is noted at 1.0995, 1.1021, 1.1052
| Levels | Levels.1 |
|---|---|
| Previous Daily High | 1.0990 |
| Previous Daily Low | 1.0934 |
| Previous Weekly High | 1.1076 |
| Previous Weekly Low | 1.0837 |
| Previous Monthly High | 1.0930 |
| Previous Monthly Low | 1.0516 |
| Daily Fibonacci 38.2% | 1.0968 |
| Daily Fibonacci 61.8% | 1.0955 |
| Daily Pivot Point S1 | 1.0939 |
| Daily Pivot Point S2 | 1.0908 |
| Daily Pivot Point S3 | 1.0883 |
| Daily Pivot Point R1 | 1.0995 |
| Daily Pivot Point R2 | 1.1021 |
| Daily Pivot Point R3 | 1.1052 |
[/s2If]
Join Our Telegram Group
")


