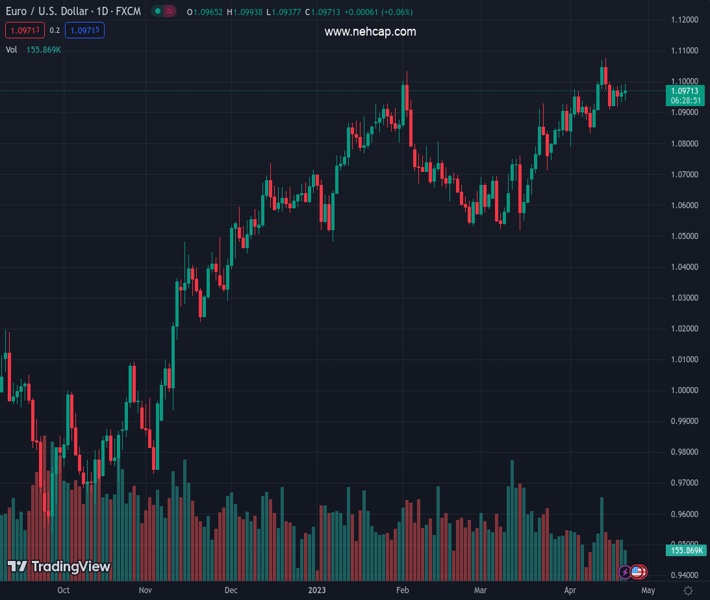
#EURUSD @ 1.09721 US Dollar jumps across the board after PMI survey. (Pivot Orderbook analysis)
…
This is a premium post.
[s2If !current_user_can(access_s2member_level4)]Please register for PREMIUM VERSION HERE to read full post below containing analysis. In case of any error or you think you are not able to read the full post below, please email us at support#nehcap.com [lwa][/s2If] [s2If current_user_can(access_s2member_level4)]
- US Dollar jumps across the board after PMI survey.
- EUR/USD retreats but holds above daily lows.
The pair currently trades last at 1.09721.
The previous day high was 1.099 while the previous day low was 1.0934. The daily 38.2% Fib levels comes at 1.0968, expected to provide support. Similarly, the daily 61.8% fib level is at 1.0955, expected to provide support.
The US Dollar rose sharply across the board following the release of the S&P Global PMI, sending EUR/USD under 1.0950. The pair fell from near 1.1000 toward daily lows.
“US Flash PMI data signals solid growth in private sector output as the headline figure registered an 11-month high of 53.5 in April (Mar: 52.3). Companies noted that improved demand conditions supported growth”, said S&P Global. The Composite PMI was expected at 52.8. The S&P Global Manufacturing PMI rose from 49.2 in March to 50.4 while the Service PMI from 52.6 to 53.7, both surpassing expectations.
US yields jumped to daily highs after the report. The DXY turned positive, rising toward 102.00. EUR/USD dropped from 1.0993, the highest in a week to 1.0941. The pair remained above daily lows.
Earlier on Friday, the preliminary April PMI for the Euro Zone showed mixed numbers. The Manufacturing Index dropped from 47.3 to 45.5 while the Service rose unexpectedly from 55 to 56.6. While Manufacturing hit the lowest level since May 200, the Service rose to the strongest since April 2022.
The EUR/USD weakened during the last hour but so far it stays above the 1.0920/30 area. A break lower would leave the Euro vulnerable to more losses, targeting initially the weekly low at 1.0908. The next support stands at 1.0880.
If the Euro remain above 1.0930, it would likely continue to trade sideways. The upside remains capped below 1.1000. A consolidation above 1.1000 is needed to clear the way to more gains.
Technical Levels: Supports and Resistances
EURUSD currently trading at 1.0956 at the time of writing. Pair opened at 1.097 and is trading with a change of -0.13 % .
| Overview | Overview.1 | |
|---|---|---|
| 0 | Today last price | 1.0956 |
| 1 | Today Daily Change | -0.0014 |
| 2 | Today Daily Change % | -0.1300 |
| 3 | Today daily open | 1.0970 |
The pair remains strongly bullish on the daily timeframe. It trades above its 20 SMA @ 1.091, 50 SMA 1.0761, 100 SMA @ 1.0732 and 200 SMA @ 1.0389.
| Trends | Trends.1 | |
|---|---|---|
| 0 | Daily SMA20 | 1.0910 |
| 1 | Daily SMA50 | 1.0761 |
| 2 | Daily SMA100 | 1.0732 |
| 3 | Daily SMA200 | 1.0389 |
The previous day high was 1.099 while the previous day low was 1.0934. The daily 38.2% Fib levels comes at 1.0968, expected to provide support. Similarly, the daily 61.8% fib level is at 1.0955, expected to provide support.
Note the levels of interest below:
- Pivot support is noted at 1.0939, 1.0908, 1.0883
- Pivot resistance is noted at 1.0995, 1.1021, 1.1052
| Levels | Levels.1 |
|---|---|
| Previous Daily High | 1.0990 |
| Previous Daily Low | 1.0934 |
| Previous Weekly High | 1.1076 |
| Previous Weekly Low | 1.0837 |
| Previous Monthly High | 1.0930 |
| Previous Monthly Low | 1.0516 |
| Daily Fibonacci 38.2% | 1.0968 |
| Daily Fibonacci 61.8% | 1.0955 |
| Daily Pivot Point S1 | 1.0939 |
| Daily Pivot Point S2 | 1.0908 |
| Daily Pivot Point S3 | 1.0883 |
| Daily Pivot Point R1 | 1.0995 |
| Daily Pivot Point R2 | 1.1021 |
| Daily Pivot Point R3 | 1.1052 |
[/s2If]
Join Our Telegram Group
")


