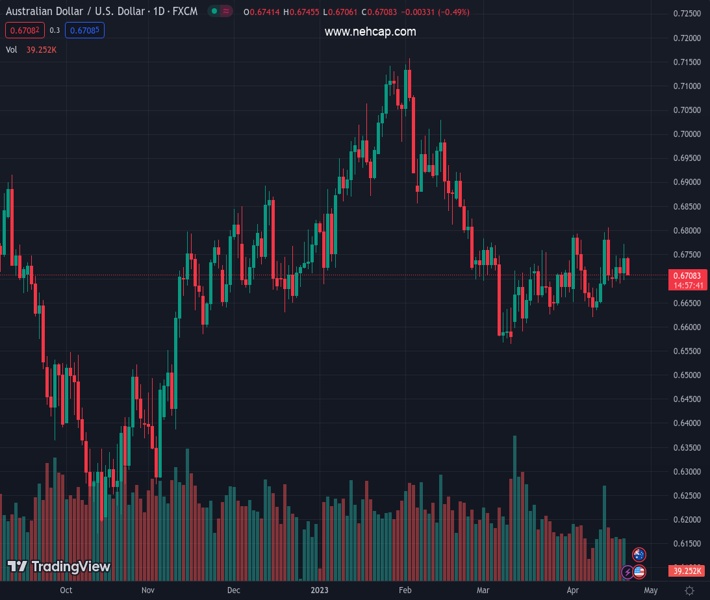
#AUDUSD @ 0.67091 has stretched its downside below 0.6710 amid a recovery in the USD Index. (Pivot Orderbook analysis)
…
This is a premium post.
[s2If !current_user_can(access_s2member_level4)]Please register for PREMIUM VERSION HERE to read full post below containing analysis. In case of any error or you think you are not able to read the full post below, please email us at support#nehcap.com [lwa][/s2If] [s2If current_user_can(access_s2member_level4)]
- AUD/USD has stretched its downside below 0.6710 amid a recovery in the USD Index.
- Fed policymakers are not ready to tone down their hawkish stance on interest rates despite slowdown fears.
- The Australian Dollar has faced immense pressure after mixed preliminary S&P PMI data.
The pair currently trades last at 0.67091.
The previous day high was 0.6772 while the previous day low was 0.6697. The daily 38.2% Fib levels comes at 0.6743, expected to provide resistance. Similarly, the daily 61.8% fib level is at 0.6725, expected to provide resistance.
The AUD/USD pair has extended its downside to near 0.6714 in the early London session. The Aussie asset is expected to move south further as the US Dollar Index (DXY) has shown a recovery move after building a base around 101.80.
The USD Index has scaled to near 101.86 and is expected to accelerate further. Investors are pouring funds into the USD Index amid a cautionary mood. S&P500 futures are flat in early Europe after three bearish trading sessions to dodge quarterly result season-inspired volatility. Meanwhile, the US Treasury yields are still struggling for recovery. The return provided on 10-year US Treasury yields is hovering around 3.52%.
The headline from a leaked US Intelligence report that China is building sophisticated cyber weapons to “seize control” of enemy satellites, rendering them useless for data signals or surveillance during wartime, as reported by Financial Times, has also increased appeal for the USD Index as a safe-haven.
Despite knowing the fact that United States manufacturing activities have been contracting for the past few months and labor market conditions have cool down further amid rising weekly jobless claims, Federal Reserve (Fed) policymakers are not ready to tone down their hawkish stance on interest rates.
Cleveland Federal Reserve President Loretta Mester reiterated on Thursday that the Fed has more work to do with inflation in the US staying too high, per Reuters. He further added, “Fed will need to hike policy rate to over 5% and hold there for a while.”
The Australian Dollar is facing immense pressure after mixed preliminary S&P PMI (April) data. Manufacturing PMI softened heavily to 48.1 from the consensus of 48.8 and the former release of 49.1. While Services PMI jumped to 52.6 vs. the prior release of 50.7.
Technical Levels: Supports and Resistances
AUDUSD currently trading at 0.6712 at the time of writing. Pair opened at 0.6741 and is trading with a change of -0.43 % .
| Overview | Overview.1 | |
|---|---|---|
| 0 | Today last price | 0.6712 |
| 1 | Today Daily Change | -0.0029 |
| 2 | Today Daily Change % | -0.4300 |
| 3 | Today daily open | 0.6741 |
The pair is trading above its 20 Daily moving average @ 0.6702, below its 50 Daily moving average @ 0.6731 , below its 100 Daily moving average @ 0.6799 and below its 200 Daily moving average @ 0.6743
| Trends | Trends.1 | |
|---|---|---|
| 0 | Daily SMA20 | 0.6702 |
| 1 | Daily SMA50 | 0.6731 |
| 2 | Daily SMA100 | 0.6799 |
| 3 | Daily SMA200 | 0.6743 |
The previous day high was 0.6772 while the previous day low was 0.6697. The daily 38.2% Fib levels comes at 0.6743, expected to provide resistance. Similarly, the daily 61.8% fib level is at 0.6725, expected to provide resistance.
Note the levels of interest below:
- Pivot support is noted at 0.6701, 0.6662, 0.6627
- Pivot resistance is noted at 0.6776, 0.6811, 0.6851
| Levels | Levels.1 |
|---|---|
| Previous Daily High | 0.6772 |
| Previous Daily Low | 0.6697 |
| Previous Weekly High | 0.6806 |
| Previous Weekly Low | 0.6620 |
| Previous Monthly High | 0.6784 |
| Previous Monthly Low | 0.6564 |
| Daily Fibonacci 38.2% | 0.6743 |
| Daily Fibonacci 61.8% | 0.6725 |
| Daily Pivot Point S1 | 0.6701 |
| Daily Pivot Point S2 | 0.6662 |
| Daily Pivot Point S3 | 0.6627 |
| Daily Pivot Point R1 | 0.6776 |
| Daily Pivot Point R2 | 0.6811 |
| Daily Pivot Point R3 | 0.6851 |
[/s2If]
Join Our Telegram Group
")


