Asian indices are bearish after tracking negative cues from S&P500. (Pivot Orderbook analysis)
…
This is a premium post.
[s2If !current_user_can(access_s2member_level4)]Please register for PREMIUM VERSION HERE to read full post below containing analysis. In case of any error or you think you are not able to read the full post below, please email us at support#nehcap.com [lwa][/s2If] [s2If current_user_can(access_s2member_level4)]
- Asian indices are bearish after tracking negative cues from S&P500.
- Continuous hawkish commentaries from Fed policymakers are weighing heavily on market sentiment.
- Accelerating Japan’s CPI indicates that the BoJ is well on track to keeping inflation steadily above 2%.
The pair currently trades last at 28590.32.
The previous day high was 28680.62 while the previous day low was 28462.29. The daily 38.2% Fib levels comes at 28597.22, expected to provide resistance. Similarly, the daily 61.8% fib level is at 28545.69, expected to provide support.
Markets in the Asian domain have witnessed a steep after tracing Thursday’s action from S&P500. US equities fell sharply on Thursday as investor shifts their focus toward a fresh rate hike from the Federal Reserve (Fed). Continuous hawkish commentaries from Fed policymakers are weighing heavily on market sentiment.
The US Dollar Index (DXY) has turned sideways around 101.80 after wild moves influenced by the release of 11th consecutive lower-than-projected weekly jobless claims data. The number of individuals claiming due to unemployment rose to 245K from the consensus of 240K. This signals a cool down in the tight labor market but doesn’t fade the need of more rate hikes from the Fed.
At the press time, Japan’s Nikkei225 eased 0.13%, SZSE Component plunged 1.14%, Hang Seng dropped 0.67%, and Nifty50 added 0.11%.
Japanese stocks are moderately negative on Friday after higher-than-anticipated National Consumer Price Index (CPI) data. Annual national CPI (March) accelerated to 3.2% from the consensus of 2.6% and core PCI jumped to 3.8% vs. the estimates of 3.4%.
A marginal decline in headline CPI from prior figures is the outcome of declining oil prices in the international market. While, walking core inflation indicates signs of a consistent jump in retail demand, supported by the continuation of ultra-loose monetary policy by the Bank of Japan (BoJ) and stimulus for raising wages.
Chinese equities failed to capitalize on commentary from Zou Lan, head of monetary policy, at People Bank of China (PBOC) that the central bank “will continue implementing prudent monetary policy.” He further added, “He sees no basis for long-term deflation or inflation in the country.”
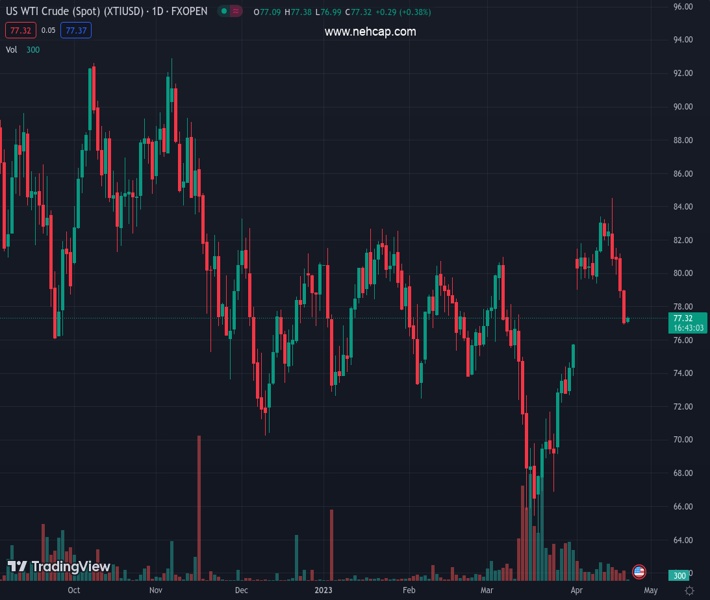
On the oil front, oil prices are struggling to defend their auction above $77.00 as global central banks are preparing for a fresh rate hike cycle to dial back persistent inflation.
Technical Levels: Supports and Resistances
XTIUSD currently trading at 28590.32 at the time of writing. Pair opened at 28590.32 and is trading with a change of 0.0 % .
| Overview | Overview.1 | |
|---|---|---|
| 0 | Today last price | 28590.32 |
| 1 | Today Daily Change | 0.00 |
| 2 | Today Daily Change % | 0.00 |
| 3 | Today daily open | 28590.32 |
The pair remains strongly bullish on the daily timeframe. It trades above its 20 SMA @ 28076.2, 50 SMA 27766.17, 100 SMA @ 27349.71 and 200 SMA @ 27505.02.
| Trends | Trends.1 | |
|---|---|---|
| 0 | Daily SMA20 | 28076.20 |
| 1 | Daily SMA50 | 27766.17 |
| 2 | Daily SMA100 | 27349.71 |
| 3 | Daily SMA200 | 27505.02 |
The previous day high was 28680.62 while the previous day low was 28462.29. The daily 38.2% Fib levels comes at 28597.22, expected to provide resistance. Similarly, the daily 61.8% fib level is at 28545.69, expected to provide support.
Note the levels of interest below:
- Pivot support is noted at 28474.87, 28359.41, 28256.54
- Pivot resistance is noted at 28693.2, 28796.07, 28911.53
| Levels | Levels.1 |
|---|---|
| Previous Daily High | 28680.62 |
| Previous Daily Low | 28462.29 |
| Previous Weekly High | 28578.70 |
| Previous Weekly Low | 27650.84 |
| Previous Monthly High | 28630.69 |
| Previous Monthly Low | 26446.43 |
| Daily Fibonacci 38.2% | 28597.22 |
| Daily Fibonacci 61.8% | 28545.69 |
| Daily Pivot Point S1 | 28474.87 |
| Daily Pivot Point S2 | 28359.41 |
| Daily Pivot Point S3 | 28256.54 |
| Daily Pivot Point R1 | 28693.20 |
| Daily Pivot Point R2 | 28796.07 |
| Daily Pivot Point R3 | 28911.53 |
[/s2If]
Join Our Telegram Group
")


