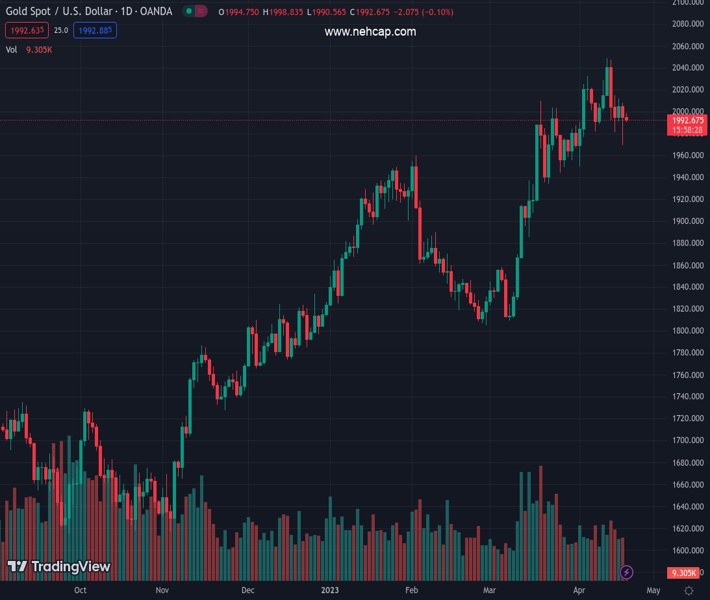
#XAUUSD @ 1,992.78 Gold price is in a sideways trend as the USD Index has shifted into a volatility contraction mode. (Pivot Orderbook analysis)
…
This is a premium post.
[s2If !current_user_can(access_s2member_level4)]Please register for PREMIUM VERSION HERE to read full post below containing analysis. In case of any error or you think you are not able to read the full post below, please email us at support#nehcap.com [lwa][/s2If] [s2If current_user_can(access_s2member_level4)]
- Gold price is in a sideways trend as the USD Index has shifted into a volatility contraction mode.
- The street is anticipating that tight credit conditions would affect the working capital management of cash-reliant firms.
- Banks have tightened conditions for disbursing credit to avoid deterioration of asset quality.
The pair currently trades last at 1992.78.
The previous day high was 2008.23 while the previous day low was 1969.26. The daily 38.2% Fib levels comes at 1984.15, expected to provide support. Similarly, the daily 61.8% fib level is at 1993.34, expected to provide resistance.
Gold price (XAU/USD) is displaying topsy-turvy moves around $1,994.00 in the early European session. The precious metal is in a directionless mode as investors are awaiting the release of preliminary United States S&P PMI data, which is scheduled for Friday.
The US Dollar Index (DXY) is demonstrating signs of volatility contraction below 102.00 after wild moves influenced by Federal Reserve’s (Fed) Beige Book. Economic activities in 12 Fed districts remained almost constant, however, the catalyst that has deepened fears of a recession in the US economy is the declining trend of advances to consumer and business loans by US commercial banks. Banks have tightened conditions for disbursing credit to avoid deterioration of asset quality.
Meanwhile, S&P futures have registered decent losses in the Asian session as investors are cautious over commentary from firms over revenue guidance. The street is anticipating that tight credit conditions would affect the working capital management of cash-reliant firms, which would impact their workflow.
Considering the event of preliminary US S&P PMI data, the street is anticipating Manufacturing PMI at 49.0, lower than the former release of 49.2. The Services PMI is also seen lower at 51.5 against the figure of 52.6 released earlier.
Investors are divided over the further direction in the Gold price as the upward-sloping trendline from March 24 low at $1,934.34 is supporting the downside. While the lower highs structure has not vanished yet despite a firmer recovery move.
The 50-period Exponential Moving Average (EMA) at $1,996.50 is acting as a barricade for the Gold bulls.
Meanwhile, the Relative Strength Index (RSI) (14) is oscillating in the 40.00-60.00 range, indicating a lackluster performance ahead.
Technical Levels: Supports and Resistances
XAUUSD currently trading at 1992.86 at the time of writing. Pair opened at 1995.08 and is trading with a change of -0.11 % .
| Overview | Overview.1 | |
|---|---|---|
| 0 | Today last price | 1992.86 |
| 1 | Today Daily Change | -2.22 |
| 2 | Today Daily Change % | -0.11 |
| 3 | Today daily open | 1995.08 |
The pair is trading below its 20 Daily moving average @ 1993.46, above its 50 Daily moving average @ 1914.88 , above its 100 Daily moving average @ 1882.96 and above its 200 Daily moving average @ 1797.66
| Trends | Trends.1 | |
|---|---|---|
| 0 | Daily SMA20 | 1993.46 |
| 1 | Daily SMA50 | 1914.88 |
| 2 | Daily SMA100 | 1882.96 |
| 3 | Daily SMA200 | 1797.66 |
The previous day high was 2008.23 while the previous day low was 1969.26. The daily 38.2% Fib levels comes at 1984.15, expected to provide support. Similarly, the daily 61.8% fib level is at 1993.34, expected to provide resistance.
Note the levels of interest below:
- Pivot support is noted at 1973.48, 1951.89, 1934.51
- Pivot resistance is noted at 2012.45, 2029.83, 2051.42
| Levels | Levels.1 |
|---|---|
| Previous Daily High | 2008.23 |
| Previous Daily Low | 1969.26 |
| Previous Weekly High | 2048.75 |
| Previous Weekly Low | 1986.28 |
| Previous Monthly High | 2009.88 |
| Previous Monthly Low | 1809.46 |
| Daily Fibonacci 38.2% | 1984.15 |
| Daily Fibonacci 61.8% | 1993.34 |
| Daily Pivot Point S1 | 1973.48 |
| Daily Pivot Point S2 | 1951.89 |
| Daily Pivot Point S3 | 1934.51 |
| Daily Pivot Point R1 | 2012.45 |
| Daily Pivot Point R2 | 2029.83 |
| Daily Pivot Point R3 | 2051.42 |
[/s2If]
Join Our Telegram Group
")


