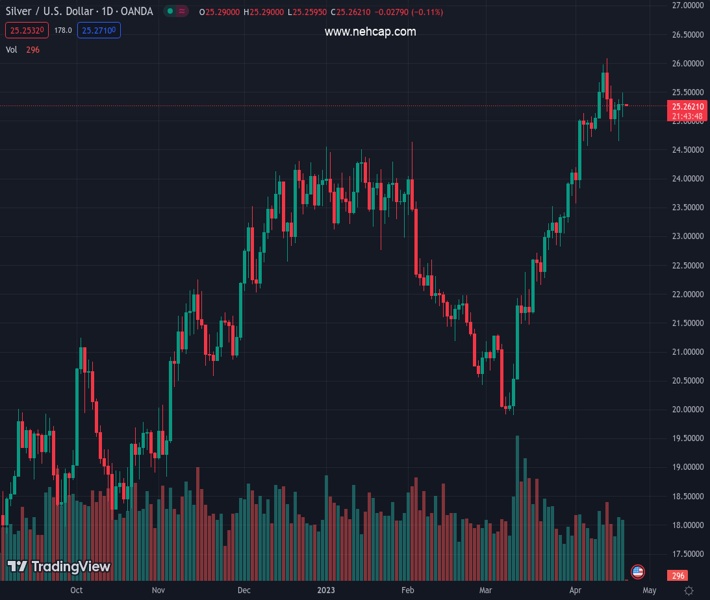
#XAGUSD @ 25.259 Silver price to remain range-bound around $25.00-$25.50 as oscillators neutralize. (Pivot Orderbook analysis)
…
This is a premium post.
[s2If !current_user_can(access_s2member_level4)]Please register for PREMIUM VERSION HERE to read full post below containing analysis. In case of any error or you think you are not able to read the full post below, please email us at support#nehcap.com [lwa][/s2If] [s2If current_user_can(access_s2member_level4)]
- Silver price to remain range-bound around $25.00-$25.50 as oscillators neutralize.
- XAG/USD Price Analysis: Upward biased above $25.00, and it can test $27.00; otherwise, it could dive towards $23.50.
The pair currently trades last at 25.259.
The previous day high was 25.37 while the previous day low was 24.64. The daily 38.2% Fib levels comes at 25.09, expected to provide support. Similarly, the daily 61.8% fib level is at 24.92, expected to provide support.
Silver price stays firm at around $25.20, consolidating for the third day in a row, as the Relative Strength Index (RSI) gets out of the overbought territory. Therefore, the XAG/USD lost traction on its way toward $26.00 a troy ounce, but the uptrend stays in play. The XAG/USD is trading at $26.26, a gain of 0.11%.
The XAG/USD is trading sideways after recovering from Wednesday’s dip toward $24.65. Even though it looks like a hammer, price action on Thursday was sideways as a classic doji emerged. As the RSI exited overbought conditions, its slope is aiming lower, meaning that sellers are gathering momentum. Meanwhile, the Rate of Change (RoC) portrays bulls jumping off the boat as buying pressure fades.
If XAG/USD remains above $25.00, in the near term, it will test the YTD high at $26.08. A breach of the latter will expose the $26.50 before the XAG/USD tests the last year’s high at $26.94, ahead of reaching $27.00.
On the other hand, the XAG/USD first support would be $25.00. Once broken, the following demand zone would be the April 19 low at $24.65, followed by the $24.00 psychological price level. A dip beyond this area will tumble Silver toward the 50-day EMA at $23.58.
Technical Levels: Supports and Resistances
XAGUSD currently trading at 25.28 at the time of writing. Pair opened at 25.29 and is trading with a change of -0.04 % .
| Overview | Overview.1 | |
|---|---|---|
| 0 | Today last price | 25.28 |
| 1 | Today Daily Change | -0.01 |
| 2 | Today Daily Change % | -0.04 |
| 3 | Today daily open | 25.29 |
The pair remains strongly bullish on the daily timeframe. It trades above its 20 SMA @ 24.41, 50 SMA 22.63, 100 SMA @ 23.05 and 200 SMA @ 21.35.
| Trends | Trends.1 | |
|---|---|---|
| 0 | Daily SMA20 | 24.41 |
| 1 | Daily SMA50 | 22.63 |
| 2 | Daily SMA100 | 23.05 |
| 3 | Daily SMA200 | 21.35 |
The previous day high was 25.37 while the previous day low was 24.64. The daily 38.2% Fib levels comes at 25.09, expected to provide support. Similarly, the daily 61.8% fib level is at 24.92, expected to provide support.
Note the levels of interest below:
- Pivot support is noted at 24.83, 24.38, 24.11
- Pivot resistance is noted at 25.56, 25.83, 26.29
| Levels | Levels.1 |
|---|---|
| Previous Daily High | 25.37 |
| Previous Daily Low | 24.64 |
| Previous Weekly High | 26.09 |
| Previous Weekly Low | 24.72 |
| Previous Monthly High | 24.16 |
| Previous Monthly Low | 19.90 |
| Daily Fibonacci 38.2% | 25.09 |
| Daily Fibonacci 61.8% | 24.92 |
| Daily Pivot Point S1 | 24.83 |
| Daily Pivot Point S2 | 24.38 |
| Daily Pivot Point S3 | 24.11 |
| Daily Pivot Point R1 | 25.56 |
| Daily Pivot Point R2 | 25.83 |
| Daily Pivot Point R3 | 26.29 |
[/s2If]
Join Our Telegram Group
")


