#USDMXN @ 18.0556 regains upside momentum after probing bulls the previous day., @nehcap view: Further recovery expected (Pivot Orderbook analysis)
…
This is a premium post.
[s2If !current_user_can(access_s2member_level4)]Please register for PREMIUM VERSION HERE to read full post below containing analysis. In case of any error or you think you are not able to read the full post below, please email us at support#nehcap.com [lwa][/s2If] [s2If current_user_can(access_s2member_level4)]
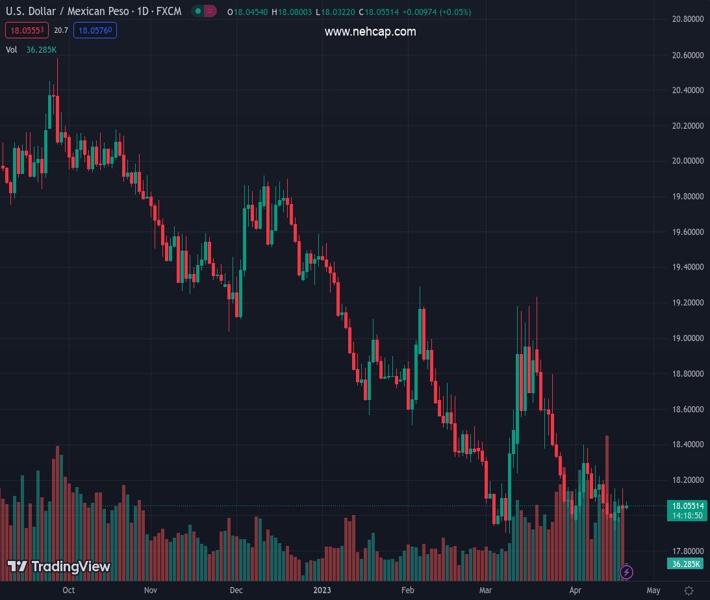
- USD/MXN regains upside momentum after probing bulls the previous day.
- Sustained trading above six-week-old ascending support line, looming bull cross on MACD favor buyers.
- 21-DMA holds the key to further run-up towards monthly top, bearish trend remain intact below 18.90.
- Downside break of 18.00 could trigger fresh fall targeting YTD low.
The pair currently trades last at 18.0556.
The previous day high was 18.1531 while the previous day low was 18.033. The daily 38.2% Fib levels comes at 18.0789, expected to provide resistance. Similarly, the daily 61.8% fib level is at 18.1072, expected to provide resistance.
USD/MXN picks up bids to 18.07 as it grinds near intraday high, up 0.15% on a day amid early Thursday in Europe.
That said, the Mexican Peso (MXN) pair snapped a three-day uptrend the previous day but failed to provide a daily closing beneath an important support line, which in turn joined a looming bull cross on the MACD indicator to recall the buyers.
Not only the impending price-positive signals on the MACD indicator and the pair’s sustained trading beyond a 1.5-month-old support line but steady RSI (14) also hints at the continuation of the recovery moves.
With this, the USD/MXN buyers are all set to approach the 21-DMA hurdle of around 18.15, a break of which could propel the prices toward the monthly high of 18.40.
It’s worth noting, however, that the USD/MXN run-up beyond 18.40 highlights a downward-sloping resistance line from the last September, around 18.90, which holds the key to reversing the pair’s multi-month-old bearish trend.
On the contrary, an upward-sloping trend line from early March, close to the 18.00 round figure, puts a floor under the USD/MXN prices for the short term.
Following that, the recently flashed multi-month low of 17.89 and lows marked in June 2017 around 17.80, as well as the year 2017 bottom surrounding 17.44, will be in the spotlight.
Trend: Further recovery expected
Technical Levels: Supports and Resistances
USDMXN currently trading at 18.0754 at the time of writing. Pair opened at 18.048 and is trading with a change of 0.15% % .
| Overview | Overview.1 | |
|---|---|---|
| 0 | Today last price | 18.0754 |
| 1 | Today Daily Change | 0.0274 |
| 2 | Today Daily Change % | 0.15% |
| 3 | Today daily open | 18.048 |
The pair remains strongly bearish on the daily time frame. It trades below the 20 SMA @ 18.164, 50 SMA 18.3443, 100 SMA @ 18.7876 and 200 SMA @ 19.3825.
| Trends | Trends.1 | |
|---|---|---|
| 0 | Daily SMA20 | 18.1640 |
| 1 | Daily SMA50 | 18.3443 |
| 2 | Daily SMA100 | 18.7876 |
| 3 | Daily SMA200 | 19.3825 |
The previous day high was 18.1531 while the previous day low was 18.033. The daily 38.2% Fib levels comes at 18.0789, expected to provide resistance. Similarly, the daily 61.8% fib level is at 18.1072, expected to provide resistance.
Note the levels of interest below:
- Pivot support is noted at 18.003, 17.9579, 17.8829
- Pivot resistance is noted at 18.1231, 18.1982, 18.2433
| Levels | Levels.1 |
|---|---|
| Previous Daily High | 18.1531 |
| Previous Daily Low | 18.0330 |
| Previous Weekly High | 18.2844 |
| Previous Weekly Low | 17.9753 |
| Previous Monthly High | 19.2324 |
| Previous Monthly Low | 17.8977 |
| Daily Fibonacci 38.2% | 18.0789 |
| Daily Fibonacci 61.8% | 18.1072 |
| Daily Pivot Point S1 | 18.0030 |
| Daily Pivot Point S2 | 17.9579 |
| Daily Pivot Point S3 | 17.8829 |
| Daily Pivot Point R1 | 18.1231 |
| Daily Pivot Point R2 | 18.1982 |
| Daily Pivot Point R3 | 18.2433 |
[/s2If]
Join Our Telegram Group
")


