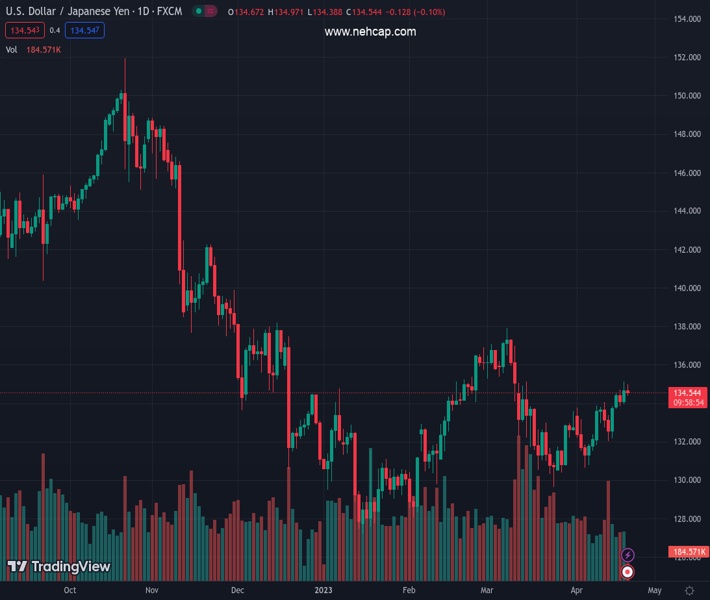
#USDJPY @ 134.561 oscillates in a narrow trading band near a multi-week high touched on Wednesday. (Pivot Orderbook analysis)
…
This is a premium post.
[s2If !current_user_can(access_s2member_level4)]Please register for PREMIUM VERSION HERE to read full post below containing analysis. In case of any error or you think you are not able to read the full post below, please email us at support#nehcap.com [lwa][/s2If] [s2If current_user_can(access_s2member_level4)]
- USD/JPY oscillates in a narrow trading band near a multi-week high touched on Wednesday.
- The risk-off impulse benefits the safe-haven JPY and acts as a headwind amid a softer USD.
- Bets for more Fed rate hikes help limit losses for the USD and lend some support to the pair.
The pair currently trades last at 134.561.
The previous day high was 135.14 while the previous day low was 133.95. The daily 38.2% Fib levels comes at 134.69, expected to provide resistance. Similarly, the daily 61.8% fib level is at 134.41, expected to provide support.
The USD/JPY pair lacks any firm intraday directional bias on Thursday and seesaws between tepid gains/minor losses through the first half of the European session. The pair is currently placed around the 134.65 region, just below a five-week high touched on Wednesday and is influenced by a combination of diverging forces.
A fresh wave of the global risk-aversion trade boosts demand for traditional safe-haven assets and benefits the Japanese Yen (JPY). Apart from this, a modest US Dollar (USD) downtick, led by the ongoing pullback in the US Treasury bond yields from a nearly one-month high touched on Thursday, acts as a headwind for the USD/JPY pair. Meanwhile, an intraday decline in the US bond yields narrows the US-Japan rate differential and lends additional support to the JPY.
That said, the prospects for further policy tightening by the Federal Reserve (Fed) should help limit the downside for the US bond yields and favours the USD bulls. In fact, the markets seem convinced that the Fed will continue raising interest rates and have fully priced in a 25 basis point (bps) lift-off in May. Moreover, the Fed funds futures indicate a small chance of another rate hike at the June FOMC meeting in the wake of the recent hawkish comments by Fed officials.
In contrast, the new Bank of Japan (BoJ) Governor Kazuo Ueda reiterated earlier this week that there is no immediate need to review the 2013 joint statement with the government and that the central bank will maintain current monetary easing. The dovish BoJ stance might further hold back traders from placing aggressive bullish bets around the JPY. The Fed-BoJ policy divergence suggests that the path of least resistance for the USD/JPY pair remains to the upside.
Market participants now look to the US economic docket, featuring the release of the usual Weekly Initial Jobless Claim, the Philly Fed Manufacturing Index and Existing Home Sales data later during the early North American session. This, along with speeches by influential FOMC members and the US bond yields, will drive the USD demand and provide some impetus to the USD/JPY pair. Traders will further take cues from the broader risk sentiment to grab short-term opportunities.
Technical Levels: Supports and Resistances
USDJPY currently trading at 134.58 at the time of writing. Pair opened at 134.71 and is trading with a change of -0.1 % .
| Overview | Overview.1 | |
|---|---|---|
| 0 | Today last price | 134.58 |
| 1 | Today Daily Change | -0.13 |
| 2 | Today Daily Change % | -0.10 |
| 3 | Today daily open | 134.71 |
The pair is trading above its 20 Daily moving average @ 132.59, above its 50 Daily moving average @ 133.63 , above its 100 Daily moving average @ 133.02 and below its 200 Daily moving average @ 137.12
| Trends | Trends.1 | |
|---|---|---|
| 0 | Daily SMA20 | 132.59 |
| 1 | Daily SMA50 | 133.63 |
| 2 | Daily SMA100 | 133.02 |
| 3 | Daily SMA200 | 137.12 |
The previous day high was 135.14 while the previous day low was 133.95. The daily 38.2% Fib levels comes at 134.69, expected to provide resistance. Similarly, the daily 61.8% fib level is at 134.41, expected to provide support.
Note the levels of interest below:
- Pivot support is noted at 134.06, 133.41, 132.88
- Pivot resistance is noted at 135.25, 135.79, 136.44
| Levels | Levels.1 |
|---|---|
| Previous Daily High | 135.14 |
| Previous Daily Low | 133.95 |
| Previous Weekly High | 134.04 |
| Previous Weekly Low | 131.83 |
| Previous Monthly High | 137.91 |
| Previous Monthly Low | 129.64 |
| Daily Fibonacci 38.2% | 134.69 |
| Daily Fibonacci 61.8% | 134.41 |
| Daily Pivot Point S1 | 134.06 |
| Daily Pivot Point S2 | 133.41 |
| Daily Pivot Point S3 | 132.88 |
| Daily Pivot Point R1 | 135.25 |
| Daily Pivot Point R2 | 135.79 |
| Daily Pivot Point R3 | 136.44 |
[/s2If]
Join Our Telegram Group
")


