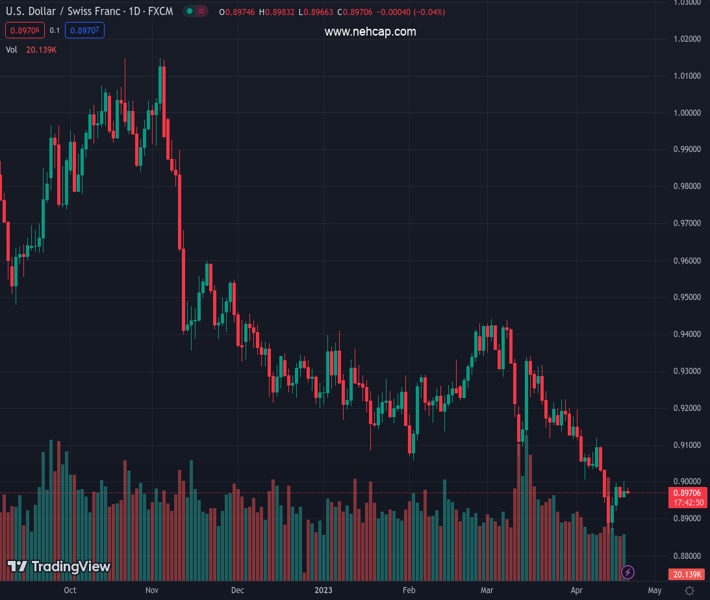
#USDCHF @ 0.89711 takes offers to extend the previous day’s pullback from one-week high., @nehcap view: Further downside expected (Pivot Orderbook analysis)
…
This is a premium post.
[s2If !current_user_can(access_s2member_level4)]Please register for PREMIUM VERSION HERE to read full post below containing analysis. In case of any error or you think you are not able to read the full post below, please email us at support#nehcap.com [lwa][/s2If] [s2If current_user_can(access_s2member_level4)]
- USD/CHF takes offers to extend the previous day’s pullback from one-week high.
- Multiple levels marked since previous Wednesday restrict immediate downside of Swiss Franc pair.
- Buyers have bumpy road to travel before taking control, 0.9040 is the key hurdle.
The pair currently trades last at 0.89711.
The previous day high was 0.9003 while the previous day low was 0.8958. The daily 38.2% Fib levels comes at 0.8986, expected to provide resistance. Similarly, the daily 61.8% fib level is at 0.8975, expected to provide resistance.
USD/CHF holds lower ground near the intraday bottom of near 0.8965 as it keeps the previous day’s U-turn from a one-week high during early Thursday. In doing so, the Swiss Franc (CHF) pair defends the U-turn from the 50-bar Exponential Moving Average (EMA).
Given the recently diminishing strength of the bullish MACD signals, as well as the quote’s repeated failures to cross the 50-EMA hurdle, the USD/CHF price is likely to decline further.
However, one-week-old horizontal support around 0.8955 restricts the immediate downside of the pair.
Following that, 0.8920 and the 0.8900 round figure may prod the USD/CHF bears before directing them to the multi-month low of around 0.8860 marked in the last week.
Should the quote remains bearish past 0.8860, it becomes vulnerable to visiting the 2021 bottom surrounding 0.8755. Though, the 0.8800 threshold may act as a buffer during the likely fall.
Meanwhile, an upside break of the 50-EMA hurdle of 0.8987 isn’t a blockbuster ticket for the USD/CHF buyers as a 13-day-old descending trend line and a downward-sloping trend line from early March, respectively near 0.8995 and 0.9030, could challenge the upside moves.
Even if the quote rises past 0.9030, the 100-SMA acts as the last defense of the USD/CHF bears before welcoming the bulls with open hands.
Trend: Further downside expected
Technical Levels: Supports and Resistances
USDCHF currently trading at 0.8968 at the time of writing. Pair opened at 0.8975 and is trading with a change of -0.08% % .
| Overview | Overview.1 | |
|---|---|---|
| 0 | Today last price | 0.8968 |
| 1 | Today Daily Change | -0.0007 |
| 2 | Today Daily Change % | -0.08% |
| 3 | Today daily open | 0.8975 |
The pair remains strongly bearish on the daily time frame. It trades below the 20 SMA @ 0.9069, 50 SMA 0.9201, 100 SMA @ 0.9237 and 200 SMA @ 0.9476.
| Trends | Trends.1 | |
|---|---|---|
| 0 | Daily SMA20 | 0.9069 |
| 1 | Daily SMA50 | 0.9201 |
| 2 | Daily SMA100 | 0.9237 |
| 3 | Daily SMA200 | 0.9476 |
The previous day high was 0.9003 while the previous day low was 0.8958. The daily 38.2% Fib levels comes at 0.8986, expected to provide resistance. Similarly, the daily 61.8% fib level is at 0.8975, expected to provide resistance.
Note the levels of interest below:
- Pivot support is noted at 0.8954, 0.8934, 0.8909
- Pivot resistance is noted at 0.9, 0.9024, 0.9045
| Levels | Levels.1 |
|---|---|
| Previous Daily High | 0.9003 |
| Previous Daily Low | 0.8958 |
| Previous Weekly High | 0.9114 |
| Previous Weekly Low | 0.8860 |
| Previous Monthly High | 0.9440 |
| Previous Monthly Low | 0.9072 |
| Daily Fibonacci 38.2% | 0.8986 |
| Daily Fibonacci 61.8% | 0.8975 |
| Daily Pivot Point S1 | 0.8954 |
| Daily Pivot Point S2 | 0.8934 |
| Daily Pivot Point S3 | 0.8909 |
| Daily Pivot Point R1 | 0.9000 |
| Daily Pivot Point R2 | 0.9024 |
| Daily Pivot Point R3 | 0.9045 |
[/s2If]
Join Our Telegram Group
")


