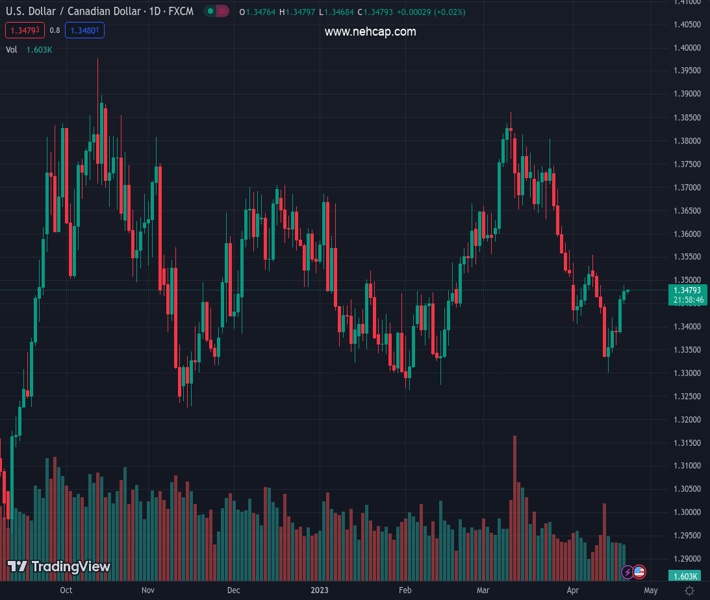
#USDCAD @ 1.34740 is marching towards 1.3500 as weak oil prices have impacted the Canadian Dollar. (Pivot Orderbook analysis)
…
This is a premium post.
[s2If !current_user_can(access_s2member_level4)]Please register for PREMIUM VERSION HERE to read full post below containing analysis. In case of any error or you think you are not able to read the full post below, please email us at support#nehcap.com [lwa][/s2If] [s2If current_user_can(access_s2member_level4)]
- USD/CAD is marching towards 1.3500 as weak oil prices have impacted the Canadian Dollar.
- Monthly Retail Sales data (Feb) are expected to contract by 0.5% vs. an expansion of 1.4% recorded in January.
- USD/CAD is struggling in extending its upside journey after reaching near the 38.2% Fibo retracement at 1.3493.
The pair currently trades last at 1.34740.
The previous day high was 1.3467 while the previous day low was 1.338. The daily 38.2% Fib levels comes at 1.3434, expected to provide support. Similarly, the daily 61.8% fib level is at 1.3413, expected to provide support.
The USD/CAD pair is gathering strength to recapture the psychological resistance of 1.3500 in the early Tokyo session. The Loonie asset is showing enormous strength despite a corrective move in the US Dollar Index (DXY). The USD Index has corrected sharply below 101.80 after failing to recapture the critical resistance of 102.00.
Therefore, the strength in the Loonie asset is coming from the weak Canadian Dollar, which is the outcome of diving oil prices. The oil price is on the verge of slipping below the immediate support of $77.00. The downside journey in the oil price is expected to find an intermediate support of around $75.65. The black gold has surrendered the majority of gains generated after the surprise announcement of production cuts by OPEC+.
Volatility is expected from the Canadian Dollar ahead of the release of Canada’s Retail Sales data. As per the consensus, monthly Retail Sales data (Feb) are expected to contract by 0.5% vs. an expansion of 1.4% recorded in January. Weak retail demand would provide some relief to the Bank of Canada (BoC) ahead.
USD/CAD witnessed a steep rise after breaking above the downward-sloping trendline plotted from March 24 high at 1.3804 on a two-hour scale. The Loonie asset is struggling in extending its upside journey after reaching near the 38.2% Fibonacci retracement (plotted from March 24 high at 1.3804 to April 14 low at 1.3300) at 1.3493.
The 20-period Exponential Moving Average (EMA) at 1.3458 is providing support to the US Dollar.
Meanwhile, the Relative Strength Index (RSI) (14) is oscillating in the bullish range of 60.00-80.00, indicating more upside ahead.
A decisive break above 38.2% Fibo retracement at around 1.3500 will drive the asset toward the April 10 high at 1.3554. A breach of the latter will expose the asset to round-level resistance at 1.3600.
On the flip side, a break below the round-level support of 1.3300 will drag the Loonie asset toward February 01 low at 1.3267, followed by 15 November 2022 low at 1.3226.
Technical Levels: Supports and Resistances
USDCAD currently trading at 1.3478 at the time of writing. Pair opened at 1.3461 and is trading with a change of 0.13 % .
| Overview | Overview.1 | |
|---|---|---|
| 0 | Today last price | 1.3478 |
| 1 | Today Daily Change | 0.0017 |
| 2 | Today Daily Change % | 0.1300 |
| 3 | Today daily open | 1.3461 |
The pair is trading below its 20 Daily moving average @ 1.3502, below its 50 Daily moving average @ 1.3562 , below its 100 Daily moving average @ 1.3528 and above its 200 Daily moving average @ 1.3407
| Trends | Trends.1 | |
|---|---|---|
| 0 | Daily SMA20 | 1.3502 |
| 1 | Daily SMA50 | 1.3562 |
| 2 | Daily SMA100 | 1.3528 |
| 3 | Daily SMA200 | 1.3407 |
The previous day high was 1.3467 while the previous day low was 1.338. The daily 38.2% Fib levels comes at 1.3434, expected to provide support. Similarly, the daily 61.8% fib level is at 1.3413, expected to provide support.
Note the levels of interest below:
- Pivot support is noted at 1.3405, 1.3349, 1.3317
- Pivot resistance is noted at 1.3492, 1.3523, 1.358
| Levels | Levels.1 |
|---|---|
| Previous Daily High | 1.3467 |
| Previous Daily Low | 1.3380 |
| Previous Weekly High | 1.3554 |
| Previous Weekly Low | 1.3301 |
| Previous Monthly High | 1.3862 |
| Previous Monthly Low | 1.3508 |
| Daily Fibonacci 38.2% | 1.3434 |
| Daily Fibonacci 61.8% | 1.3413 |
| Daily Pivot Point S1 | 1.3405 |
| Daily Pivot Point S2 | 1.3349 |
| Daily Pivot Point S3 | 1.3317 |
| Daily Pivot Point R1 | 1.3492 |
| Daily Pivot Point R2 | 1.3523 |
| Daily Pivot Point R3 | 1.3580 |
[/s2If]
Join Our Telegram Group
")


