#GBPUSD @ 1.24312 struggles to defend latest gains, prints mild losses while snapping two-day uptrend., @nehcap view: Further downside expected (Pivot Orderbook analysis)
…
This is a premium post.
[s2If !current_user_can(access_s2member_level4)]Please register for PREMIUM VERSION HERE to read full post below containing analysis. In case of any error or you think you are not able to read the full post below, please email us at support#nehcap.com [lwa][/s2If] [s2If current_user_can(access_s2member_level4)]
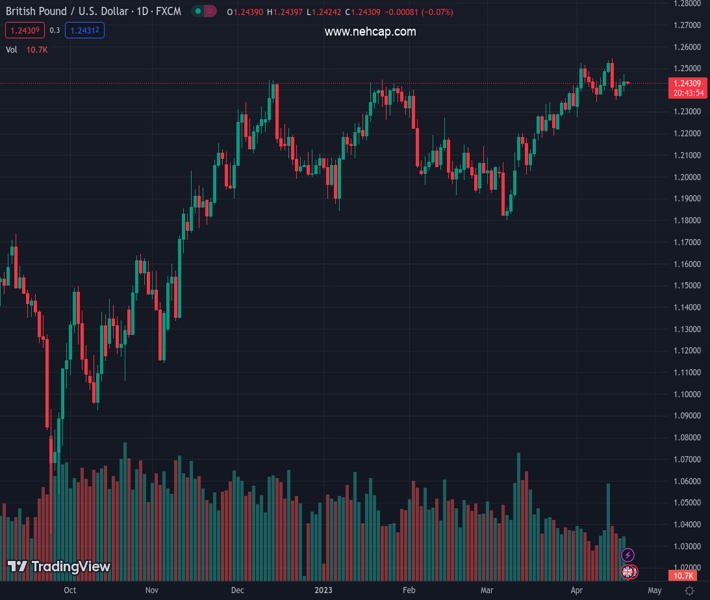
- GBP/USD struggles to defend latest gains, prints mild losses while snapping two-day uptrend.
- Clear downside break of one-month-old previous support line joins sluggish MACD signals, steady RSI to tease sellers.
- 100-EMA, ascending support line from early April challenge Cable bears.
The pair currently trades last at 1.24312.
The previous day high was 1.2474 while the previous day low was 1.2392. The daily 38.2% Fib levels comes at 1.2443, expected to provide resistance. Similarly, the daily 61.8% fib level is at 1.2424, expected to provide support.
GBP/USD remains pressured around 1.2430, printing minor losses amid Thursday’s Asian session after a two-day uptrend. In doing so, the Cable pair stays on the bear’s radar amid multiple failures to cross the previous support line stretched from late March.
Adding strength to the downside bias could be the sluggish MACD signals and steady RSI (14) line.
However, the 100-SMA and a one-month-old resistance line, respectively near 1.2400 and 1.2370, restrict the GBP/USD pair’s short-term downside.
It’s worth noting that a short-term horizontal line around 1.2350 holds the key to the GBP/USD pair’s slump toward the monthly low of 1.2275.
Following that, the late March swing low near 1.2190 and the 1.2000 round figure will gain the market’s attention.
On the flip side, a clear upside break of the 1.2470 support-turned-resistance will be enough for the GBP/USD buyers to retake control.
In that case, the 1.2500 round figure and the monthly high of near 1.2550 should gain major attention before directing the Cable pair buyers towards the May 2022 high of near 1.2665.
Overall, GBP/USD is likely to remain downbeat unless crossing 1.2470.
Trend: Further downside expected
Technical Levels: Supports and Resistances
GBPUSD currently trading at 1.2428 at the time of writing. Pair opened at 1.244 and is trading with a change of -0.10% % .
| Overview | Overview.1 | |
|---|---|---|
| 0 | Today last price | 1.2428 |
| 1 | Today Daily Change | -0.0012 |
| 2 | Today Daily Change % | -0.10% |
| 3 | Today daily open | 1.244 |
The pair remains strongly bullish on the daily timeframe. It trades above its 20 SMA @ 1.2394, 50 SMA 1.2195, 100 SMA @ 1.2194 and 200 SMA @ 1.1921.
| Trends | Trends.1 | |
|---|---|---|
| 0 | Daily SMA20 | 1.2394 |
| 1 | Daily SMA50 | 1.2195 |
| 2 | Daily SMA100 | 1.2194 |
| 3 | Daily SMA200 | 1.1921 |
The previous day high was 1.2474 while the previous day low was 1.2392. The daily 38.2% Fib levels comes at 1.2443, expected to provide resistance. Similarly, the daily 61.8% fib level is at 1.2424, expected to provide support.
Note the levels of interest below:
- Pivot support is noted at 1.2397, 1.2354, 1.2315
- Pivot resistance is noted at 1.2478, 1.2517, 1.256
| Levels | Levels.1 |
|---|---|
| Previous Daily High | 1.2474 |
| Previous Daily Low | 1.2392 |
| Previous Weekly High | 1.2546 |
| Previous Weekly Low | 1.2344 |
| Previous Monthly High | 1.2424 |
| Previous Monthly Low | 1.1803 |
| Daily Fibonacci 38.2% | 1.2443 |
| Daily Fibonacci 61.8% | 1.2424 |
| Daily Pivot Point S1 | 1.2397 |
| Daily Pivot Point S2 | 1.2354 |
| Daily Pivot Point S3 | 1.2315 |
| Daily Pivot Point R1 | 1.2478 |
| Daily Pivot Point R2 | 1.2517 |
| Daily Pivot Point R3 | 1.2560 |
[/s2If]
Join Our Telegram Group
")


