#EURUSD @ 1.09681 US Initial Jobless Claims for the latest week jump, as manufacturing activity plunges as reported by the Philadelphia Fed. (Pivot Orderbook analysis)
…
This is a premium post.
[s2If !current_user_can(access_s2member_level4)]Please register for PREMIUM VERSION HERE to read full post below containing analysis. In case of any error or you think you are not able to read the full post below, please email us at support#nehcap.com [lwa][/s2If] [s2If current_user_can(access_s2member_level4)]
- US Initial Jobless Claims for the latest week jump, as manufacturing activity plunges as reported by the Philadelphia Fed.
- Cleveland’s Fed Loretta Mester is happy with the progress on inflation though rates need to be higher.
- EUR/USD Price Analysis: Could break towards 1.1100 once buyers reclaim 1.1000.
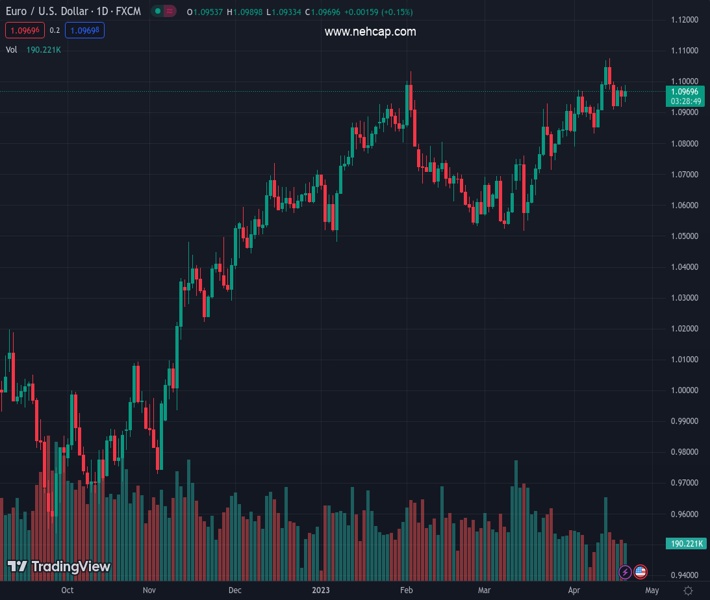
The pair currently trades last at 1.09681.
The previous day high was 1.0984 while the previous day low was 1.0917. The daily 38.2% Fib levels comes at 1.0943, expected to provide support. Similarly, the daily 61.8% fib level is at 1.0959, expected to provide support.
EUR/USD advances, trimming some of its Wednesday’s losses after data from the United States (US) displays further economic deterioration, which reignited recession fears. Hence, investors seeking safety bought the Euro (EUR) to the detriment of the US Dollar (USD). The EUR/USD trades at 1.0969, above its opening price by 0.14%.
Wall Street continues to trade with losses amidst growing concerns of an impending recession in the United States. The latest round of data pointed to a deceleration in the economy, though US Federal Reserve (Fed) officials had reiterated that a recession is not their base scenario.
The US economic calendar revealed that Initial Jobless Claims for the week ending on April 15 rose by 245K, exceeding estimates of 240K, as data from the Department of Labor (DoL) showed. At the same time, the Philadelphia Fed reported that manufacturing activity decelerated in the mid-Atlantic region, with the manufacturing index plunging -31.3 beneath March’s -23.3, a headwind for the American Dollar (USD).
The latest round of US data was that Existing Home Sales dropped 2.4% to a seasonally-adjusted annual rate (SAAR) of 4.44 million in March.
Despite the above, the CME FedWatch Tool still displays that the swaps markets expect a 25 bps hike at the May meeting, with odds at 88.6%, despite falling US Treasury bond yields. Consequently, the US Dollar Index, a measure of the buck’s value vs. a basket of six currencies, is down 0.20%, at 101.739.
Of late, the Cleveland Fed President Loretta Mester is crossing newswires and said she’s happy with the progress made on inflation. Still, inflation is too high and foresees higher interest rates.
On the Eurozone (EU), European Central Bank (ECB) policymakers continued their round of crossing newswires led by its President Christine Lagarde, saying that inflation is too strong, added that the central bank needs to do “all they can” to bring inflation to the 2% target. Earlier, Klass Knot said that the ECB might need to raise rates in June and July on top of a 25 bps hike in May.
From a daily chart perspective, the EUR/USD remains supported by the 20-day EMA from March 20 until today. As the EUR/USD dipped toward the 20-day EMA at 1.0903, the pair jumped and recorded a new cycle high. Should this be the case, the 1.1100 is up for grabs, but EUR buyers must reclaim the psychological 1.1000, followed by the YTD high at 1.1075. Conversely, a fall below 1.0900 will expose the 20-day EMA at 1.0896. If EUR/USD drops below the latter, a dive to 1.0800 is on the cards.
Technical Levels: Supports and Resistances
EURUSD currently trading at 1.0967 at the time of writing. Pair opened at 1.0955 and is trading with a change of 0.11 % .
| Overview | Overview.1 | |
|---|---|---|
| 0 | Today last price | 1.0967 |
| 1 | Today Daily Change | 0.0012 |
| 2 | Today Daily Change % | 0.1100 |
| 3 | Today daily open | 1.0955 |
The pair remains strongly bullish on the daily timeframe. It trades above its 20 SMA @ 1.0903, 50 SMA 1.0756, 100 SMA @ 1.0728 and 200 SMA @ 1.0384.
| Trends | Trends.1 | |
|---|---|---|
| 0 | Daily SMA20 | 1.0903 |
| 1 | Daily SMA50 | 1.0756 |
| 2 | Daily SMA100 | 1.0728 |
| 3 | Daily SMA200 | 1.0384 |
The previous day high was 1.0984 while the previous day low was 1.0917. The daily 38.2% Fib levels comes at 1.0943, expected to provide support. Similarly, the daily 61.8% fib level is at 1.0959, expected to provide support.
Note the levels of interest below:
- Pivot support is noted at 1.092, 1.0885, 1.0853
- Pivot resistance is noted at 1.0987, 1.1019, 1.1054
| Levels | Levels.1 |
|---|---|
| Previous Daily High | 1.0984 |
| Previous Daily Low | 1.0917 |
| Previous Weekly High | 1.1076 |
| Previous Weekly Low | 1.0837 |
| Previous Monthly High | 1.0930 |
| Previous Monthly Low | 1.0516 |
| Daily Fibonacci 38.2% | 1.0943 |
| Daily Fibonacci 61.8% | 1.0959 |
| Daily Pivot Point S1 | 1.0920 |
| Daily Pivot Point S2 | 1.0885 |
| Daily Pivot Point S3 | 1.0853 |
| Daily Pivot Point R1 | 1.0987 |
| Daily Pivot Point R2 | 1.1019 |
| Daily Pivot Point R3 | 1.1054 |
[/s2If]
Join Our Telegram Group
")


