Euro vs USD traces out a triangle-like pattern, tapering to a low-vol point in mid 1.09s.
…
This is a premium post.
[s2If !current_user_can(access_s2member_level4)]Please register for PREMIUM VERSION HERE to read full post below containing analysis. In case of any error or you think you are not able to read the full post below, please email us at support#nehcap.com [lwa][/s2If] [s2If current_user_can(access_s2member_level4)]
- Euro vs USD traces out a triangle-like pattern, tapering to a low-vol point in mid 1.09s.
- Federal Reserve’s Beige Book reaffirms the market’s mildly hawkish stance, propping up US Dollar.
- Euro awaits defining data on May 2 when ECB will release its Bank Survey and April inflation data.
The Euro (EUR) continues trading in the mid 1.09s versus the US Dollar (USD) during the early European session on Thursday. More broadly, the pair has pulled back from the recent April 14 highs of 1.1075 as the US Dollar recovers on bets the Federal Reserve (Fed) will continue raising interest rates.
From a technical perspective, the Euro-Dollar pair is in a medium-term uptrend which is biased to extend. Scoping in, price action appears to be coiling to a point, and the diminishing volatility could be the precursor for a breakout move on the horizon.
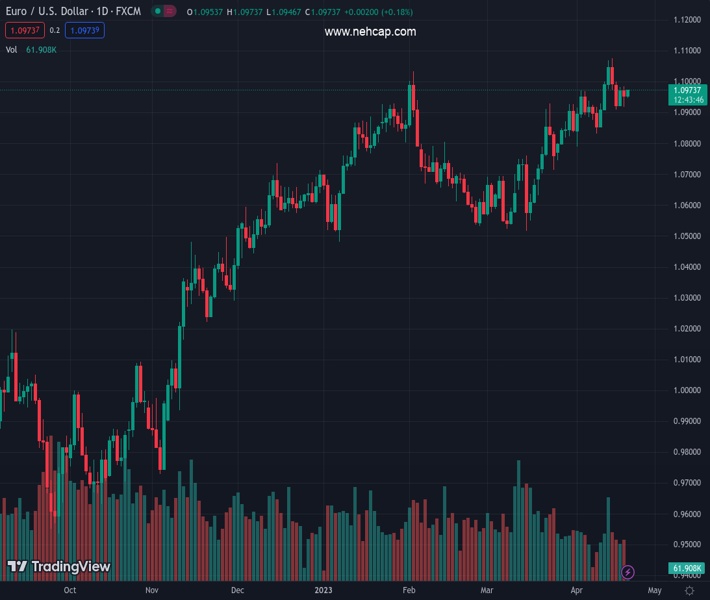
EUR/USD has been rising in a medium-term uptrend since reversing at the September 2022 lows, and this established trend is likely to continue. After a pullback in February 2023, EUR/USD recouped its losses during March and made new year-to-date highs above 1.1000 on April 13.
EUR/USD: Daily Chart
Drilling down to the 4-hour chart (below) and price action can be seen trading with steadily diminishing volatility in the mid 1.09s. It could be tracing out a triangle pattern which will eventually break out either higher or lower. Triangles are usually composed of five waves and the current wave looks like it might be the 4th wave. If so, then a breakout could be close at hand.
EUR/USD: 4-hr Chart
The Chaikin Money Flow oscillator, an indicator that is supposed to help give clues as to the eventual direction of a breakout from a range bound market, has been below the zero-line during most of the evolution of the triangle, suggesting a slight bias towards expecting a downside break.
If price pierces below 1.0909 it would probably confirm the triangle was breaking lower whilst a breach of the 1.0999 April 17 high that it was higher.
More broadly, a break and daily close above the 1.1075 year-to-date highs of April 14 would provide Euro bulls with added confidence to push price up to the next target at around 1.1190, where the 200-week Simple Moving Average (SMA) is situated and likely to provide pushback.
From a bearish perspective, a break and close below the lower high at 1.0830 would bring into question the strength and validity of the uptrend and could see losses extend down to a confluence of support at 1.0750.
[/s2If]
Join Our Telegram Group
")


