DXY resumes the downside following Wednesday’s decent gains. (Pivot Orderbook analysis)
…
This is a premium post.
[s2If !current_user_can(access_s2member_level4)]Please register for PREMIUM VERSION HERE to read full post below containing analysis. In case of any error or you think you are not able to read the full post below, please email us at support#nehcap.com [lwa][/s2If] [s2If current_user_can(access_s2member_level4)]
- DXY resumes the downside following Wednesday’s decent gains.
- Further side-lined trading is likely for the time being.
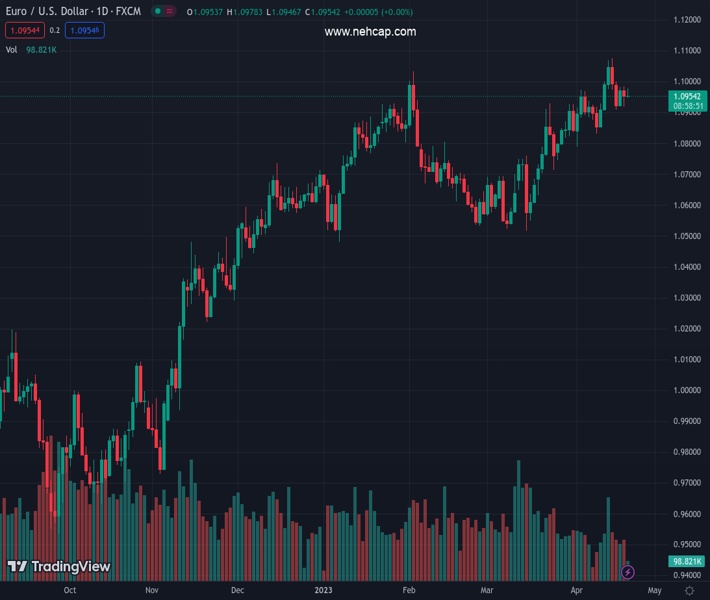
The pair currently trades last at 101.83.
The previous day high was 102.23 while the previous day low was 101.66. The daily 38.2% Fib levels comes at 102.01, expected to provide resistance. Similarly, the daily 61.8% fib level is at 101.88, expected to provide resistance.
DXY gives away Wednesday’s gains and resumes the downside amidst the broad-based range bound theme so far this week.
The index, in the meantime, maintains the choppy activity well in place so far this week. The resumption of the uptrend should face initial hurdle at the April high just above 103.00 (April 3), while bouts of weakness remain underpinned by the sub-101.00 region.
Looking at the broader picture, while below the 200-day SMA, today at 106.24, the outlook for the index is expected to remain negative.
Technical Levels: Supports and Resistances
EURUSD currently trading at 101.83 at the time of writing. Pair opened at 101.95 and is trading with a change of -0.12 % .
| Overview | Overview.1 | |
|---|---|---|
| 0 | Today last price | 101.83 |
| 1 | Today Daily Change | 25.00 |
| 2 | Today Daily Change % | -0.12 |
| 3 | Today daily open | 101.95 |
The pair remains strongly bearish on the daily time frame. It trades below the 20 SMA @ 102.13, 50 SMA 103.37, 100 SMA @ 103.46 and 200 SMA @ 106.32.
| Trends | Trends.1 | |
|---|---|---|
| 0 | Daily SMA20 | 102.13 |
| 1 | Daily SMA50 | 103.37 |
| 2 | Daily SMA100 | 103.46 |
| 3 | Daily SMA200 | 106.32 |
The previous day high was 102.23 while the previous day low was 101.66. The daily 38.2% Fib levels comes at 102.01, expected to provide resistance. Similarly, the daily 61.8% fib level is at 101.88, expected to provide resistance.
Note the levels of interest below:
- Pivot support is noted at 101.66, 101.37, 101.08
- Pivot resistance is noted at 102.23, 102.52, 102.81
| Levels | Levels.1 |
|---|---|
| Previous Daily High | 102.23 |
| Previous Daily Low | 101.66 |
| Previous Weekly High | 102.76 |
| Previous Weekly Low | 100.79 |
| Previous Monthly High | 105.89 |
| Previous Monthly Low | 101.92 |
| Daily Fibonacci 38.2% | 102.01 |
| Daily Fibonacci 61.8% | 101.88 |
| Daily Pivot Point S1 | 101.66 |
| Daily Pivot Point S2 | 101.37 |
| Daily Pivot Point S3 | 101.08 |
| Daily Pivot Point R1 | 102.23 |
| Daily Pivot Point R2 | 102.52 |
| Daily Pivot Point R3 | 102.81 |
[/s2If]
Join Our Telegram Group
")


