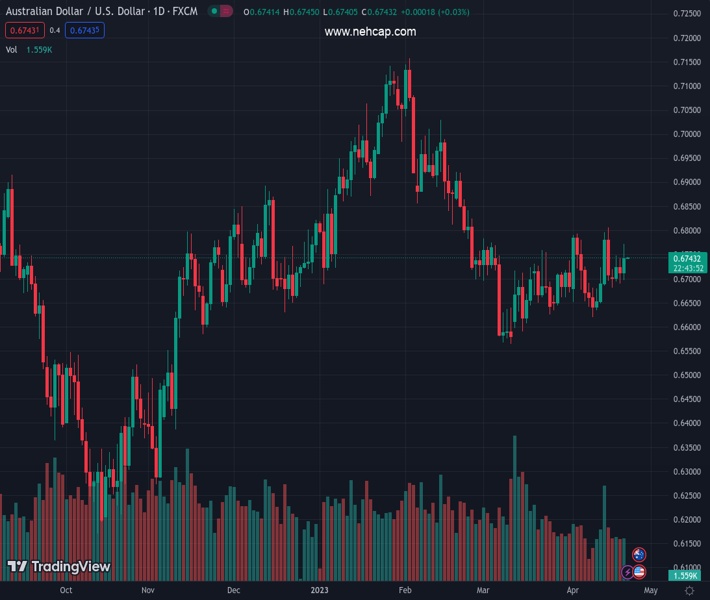
#AUDUSD @ 0.67433 has shown a rebound from 0.6730 as the upside in the USD Index looks capped. (Pivot Orderbook analysis)
…
This is a premium post.
[s2If !current_user_can(access_s2member_level4)]Please register for PREMIUM VERSION HERE to read full post below containing analysis. In case of any error or you think you are not able to read the full post below, please email us at support#nehcap.com [lwa][/s2If] [s2If current_user_can(access_s2member_level4)]
- AUD/USD has shown a rebound from 0.6730 as the upside in the USD Index looks capped.
- An increase in US weekly jobless claims indicates that labor market conditions are not tight enough for now.
- The Australian Dollar has shifted into a bullish trajectory as PBoC is ready to implement a prudent monetary policy.
The pair currently trades last at 0.67433.
The previous day high was 0.6741 while the previous day low was 0.669. The daily 38.2% Fib levels comes at 0.671, expected to provide support. Similarly, the daily 61.8% fib level is at 0.6722, expected to provide support.
The AUD/USD pair has shown a decent recovery after a corrective move to near 0.6730 in the early Asian session. The Aussie asset displayed a steep rise on Thursday after Zou Lan, head of monetary policy, at People Bank of China (PBOC) reaffirmed on Thursday that the central bank “will continue implementing prudent monetary policy.”
S&P500 witnessed a steep fall on Thursday after Tesla failed to cheer market participants from its quarterly earnings. The 500-US stock basket delivered a third consecutive bearish closing, portraying a risk aversion theme. Electric Vehicle (EV) maker Tesla reported the lowest quarterly gross margins in two years as the firm is on the path of slashing rates. The firm signaled that more price declines are in pipeline.
The US Dollar Index (DXY) showed a wild gyration in the 101.63-102.13 range and went back inside the woods. The release of the weekly jobless claims confirmed that United States labor market conditions are loosening swiftly and firms are postponing their recruitment plans. As per the report, weekly jobless claims increased to 245K, higher than the consensus and the former release of 240K for the week ending April 14.
The Australian Dollar shifted into a bullish trajectory as PBoC is ready to implement a prudent monetary policy, whenever required, to support the overall demand. Earlier, the PBoC announced an unchanged policy as the Chinese economy is well on track for economic recovery. It is worth noting that Australia is a leading trading partner of China and a quick economic recovery in China will also strengthen the Australian Dollar.
Going forward, preliminary Australian S&P PMI data will be keenly watched. As per the consensus, Manufacturing PMI will drop to 48.8 from the former release of 49.1.
Technical Levels: Supports and Resistances
AUDUSD currently trading at 0.6742 at the time of writing. Pair opened at 0.6713 and is trading with a change of 0.43 % .
| Overview | Overview.1 | |
|---|---|---|
| 0 | Today last price | 0.6742 |
| 1 | Today Daily Change | 0.0029 |
| 2 | Today Daily Change % | 0.4300 |
| 3 | Today daily open | 0.6713 |
The pair is trading above its 20 Daily moving average @ 0.6699, above its 50 Daily moving average @ 0.6735 , below its 100 Daily moving average @ 0.68 and below its 200 Daily moving average @ 0.6744
| Trends | Trends.1 | |
|---|---|---|
| 0 | Daily SMA20 | 0.6699 |
| 1 | Daily SMA50 | 0.6735 |
| 2 | Daily SMA100 | 0.6800 |
| 3 | Daily SMA200 | 0.6744 |
The previous day high was 0.6741 while the previous day low was 0.669. The daily 38.2% Fib levels comes at 0.671, expected to provide support. Similarly, the daily 61.8% fib level is at 0.6722, expected to provide support.
Note the levels of interest below:
- Pivot support is noted at 0.6689, 0.6664, 0.6637
- Pivot resistance is noted at 0.674, 0.6766, 0.6791
| Levels | Levels.1 |
|---|---|
| Previous Daily High | 0.6741 |
| Previous Daily Low | 0.6690 |
| Previous Weekly High | 0.6806 |
| Previous Weekly Low | 0.6620 |
| Previous Monthly High | 0.6784 |
| Previous Monthly Low | 0.6564 |
| Daily Fibonacci 38.2% | 0.6710 |
| Daily Fibonacci 61.8% | 0.6722 |
| Daily Pivot Point S1 | 0.6689 |
| Daily Pivot Point S2 | 0.6664 |
| Daily Pivot Point S3 | 0.6637 |
| Daily Pivot Point R1 | 0.6740 |
| Daily Pivot Point R2 | 0.6766 |
| Daily Pivot Point R3 | 0.6791 |
[/s2If]
Join Our Telegram Group
")


