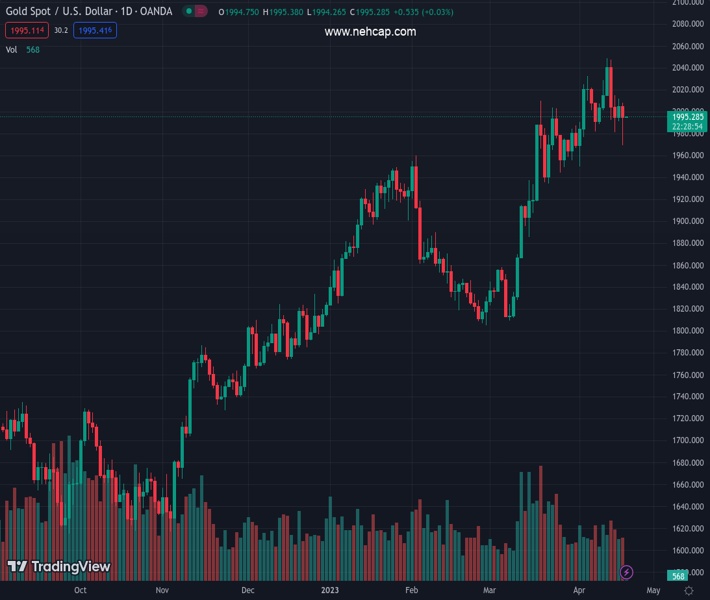
#XAUUSD @ 1,995.19 Gold price is hovering below $2,0000 after a V-shape recovery move. (Pivot Orderbook analysis)
…
This is a premium post.
[s2If !current_user_can(access_s2member_level4)]Please register for PREMIUM VERSION HERE to read full post below containing analysis. In case of any error or you think you are not able to read the full post below, please email us at support#nehcap.com [lwa][/s2If] [s2If current_user_can(access_s2member_level4)]
- Gold price is hovering below $2,0000 after a V-shape recovery move.
- The 10-year US Treasury yields jumped above 3.59% as one more rate hike by the Fed is in the pipeline.
- Several Fed districts noted that banks tightened lending standards amid increased uncertainty and concerns about liquidity.
The pair currently trades last at 1995.19.
The previous day high was 2011.9 while the previous day low was 1991.32. The daily 38.2% Fib levels comes at 2004.04, expected to provide resistance. Similarly, the daily 61.8% fib level is at 1999.18, expected to provide resistance.
Gold price (XAU/USD) is facing hurdles in extending its recovery above the immediate resistance of $1,997.00 in the early Asian session. The precious metal is struggling to recapture the psychological resistance of $2,000.00 after a V-shape recovery. A confident recovery in the Gold price from the cushion of $1,970.00 was inspired by the release of the Federal Reserve’s (Fed) Beige Book.
S&P500 futures are showing further losses in early Tokyo after back-to-back subdued trading sessions, indicating a cautious approach by market participants due to the quarterly result season. Broadly, the US Dollar Index (DXY) is showing signs of volatility contraction below 102.00 as Fed’s Beige Book failed to infuse blood into the former. Meanwhile, the 10-year US Treasury yields jumped above 3.59% as one more rate hike by the Fed is in the pipeline.
The release of the Fed’s Beige Book first after the banking turmoil confirmed that the ghost of tight credit conditions by US commercial banks, as a safety measure amid a turbulent environment, is for real.
Several districts noted that banks tightened lending standards amid increased uncertainty and concerns about liquidity, which has triggered the risk of declining economic prospects as lower advances to firms won’t let them work at the current pace. Auto sales remained moderate, confirming no further jump in retail demand ahead.
Gold price has shown a stellar recovery after dropping to near the lower portion of the Rising Channel chart pattern formed on a two-hour scale. The V-shape recovery shown by the Gold price indicates the presence of responsive buyers at lower levels, making the area value bet for the market participants. The precious metal is making efforts to shift above the 20-period Exponential Moving Average (EMA) at $1,995.40, which will make the short-term trend bullish.
Meanwhile, the Relative Strength Index (RSI) (14) has managed to get back into the 40.00-60.00 range from the bearish range of 20.00-40.00.
Technical Levels: Supports and Resistances
XAUUSD currently trading at 1994.93 at the time of writing. Pair opened at 2005.42 and is trading with a change of -0.52 % .
| Overview | Overview.1 | |
|---|---|---|
| 0 | Today last price | 1994.93 |
| 1 | Today Daily Change | -10.49 |
| 2 | Today Daily Change % | -0.52 |
| 3 | Today daily open | 2005.42 |
The pair remains strongly bullish on the daily timeframe. It trades above its 20 SMA @ 1990.71, 50 SMA 1912.38, 100 SMA @ 1880.5 and 200 SMA @ 1796.32.
| Trends | Trends.1 | |
|---|---|---|
| 0 | Daily SMA20 | 1990.71 |
| 1 | Daily SMA50 | 1912.38 |
| 2 | Daily SMA100 | 1880.50 |
| 3 | Daily SMA200 | 1796.32 |
The previous day high was 2011.9 while the previous day low was 1991.32. The daily 38.2% Fib levels comes at 2004.04, expected to provide resistance. Similarly, the daily 61.8% fib level is at 1999.18, expected to provide resistance.
Note the levels of interest below:
- Pivot support is noted at 1993.86, 1982.3, 1973.28
- Pivot resistance is noted at 2014.44, 2023.46, 2035.02
| Levels | Levels.1 |
|---|---|
| Previous Daily High | 2011.90 |
| Previous Daily Low | 1991.32 |
| Previous Weekly High | 2048.75 |
| Previous Weekly Low | 1986.28 |
| Previous Monthly High | 2009.88 |
| Previous Monthly Low | 1809.46 |
| Daily Fibonacci 38.2% | 2004.04 |
| Daily Fibonacci 61.8% | 1999.18 |
| Daily Pivot Point S1 | 1993.86 |
| Daily Pivot Point S2 | 1982.30 |
| Daily Pivot Point S3 | 1973.28 |
| Daily Pivot Point R1 | 2014.44 |
| Daily Pivot Point R2 | 2023.46 |
| Daily Pivot Point R3 | 2035.02 |
[/s2If]
Join Our Telegram Group
")


