#XAGUSD @ 25.272 Silver is still bullish but could test a four-month-old resistance-turned-support trendline nearby $24.20-40. (Pivot Orderbook analysis)
…
This is a premium post.
[s2If !current_user_can(access_s2member_level4)]Please register for PREMIUM VERSION HERE to read full post below containing analysis. In case of any error or you think you are not able to read the full post below, please email us at support#nehcap.com [lwa][/s2If] [s2If current_user_can(access_s2member_level4)]
- Silver is still bullish but could test a four-month-old resistance-turned-support trendline nearby $24.20-40.
- XAG/USD Price Analysis: It’s upward biased, though downside risks remain below $25.00.
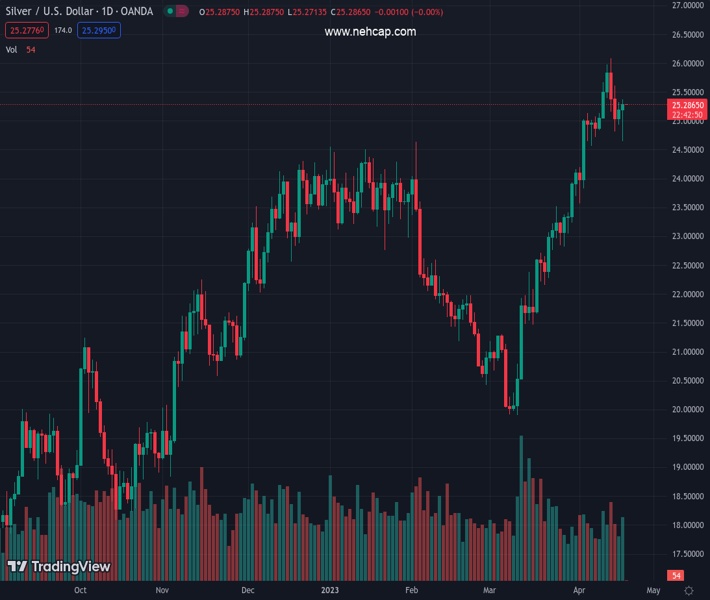
The pair currently trades last at 25.272.
The previous day high was 25.32 while the previous day low was 24.93. The daily 38.2% Fib levels comes at 25.17, expected to provide support. Similarly, the daily 61.8% fib level is at 25.08, expected to provide support.
Silver price erased its earlier losses that dragged the white metal towards testing February 2 highs at $24.63 per ounce and rallied back above the $25.00 psychological figure. Although the US Dollar (USD) remained underpinned by high US Treasury bond yields, the XAG/USD is trading at $25.25, about to finish Wednesday’s session with gains of 0.28%.
Since hitting YTD high at 26.08, the XAG/USD dropped sharply due to the overbought Relative Strength Index (RSI). Therefore, traders moved quickly to book profits, weakening Silver, which tumbled more than 5%. However, as oscillators turned neutral, the XAG/USD bottomed around $24.61, some 20-pips above the 20-day EMA.
For a bullish continuation, the XAG/USD must crack Wednesday’s high at $25.36. Once cleared, the XAG/USD next stop will be the April 17 daily high at $25.60 before posing a threat to $26.00, ahead of the YTD high at $26.08.
Conversely, the XAG/USD first support would be the psychological $25.00 level. A breakout to the downside will expose the 20-day EMA At $24.46, followed by a previously broken resistance-turned-support level at $24.20, as sellers brace towards $24,00. Once cleared, sellers will eye a test of the 50-day EMA at $23.45.
Technical Levels: Supports and Resistances
XAGUSD currently trading at 25.29 at the time of writing. Pair opened at 25.2 and is trading with a change of 0.36 % .
| Overview | Overview.1 | |
|---|---|---|
| 0 | Today last price | 25.29 |
| 1 | Today Daily Change | 0.09 |
| 2 | Today Daily Change % | 0.36 |
| 3 | Today daily open | 25.20 |
The pair remains strongly bullish on the daily timeframe. It trades above its 20 SMA @ 24.26, 50 SMA 22.57, 100 SMA @ 23.01 and 200 SMA @ 21.32.
| Trends | Trends.1 | |
|---|---|---|
| 0 | Daily SMA20 | 24.26 |
| 1 | Daily SMA50 | 22.57 |
| 2 | Daily SMA100 | 23.01 |
| 3 | Daily SMA200 | 21.32 |
The previous day high was 25.32 while the previous day low was 24.93. The daily 38.2% Fib levels comes at 25.17, expected to provide support. Similarly, the daily 61.8% fib level is at 25.08, expected to provide support.
Note the levels of interest below:
- Pivot support is noted at 24.98, 24.76, 24.59
- Pivot resistance is noted at 25.37, 25.54, 25.76
| Levels | Levels.1 |
|---|---|
| Previous Daily High | 25.32 |
| Previous Daily Low | 24.93 |
| Previous Weekly High | 26.09 |
| Previous Weekly Low | 24.72 |
| Previous Monthly High | 24.16 |
| Previous Monthly Low | 19.90 |
| Daily Fibonacci 38.2% | 25.17 |
| Daily Fibonacci 61.8% | 25.08 |
| Daily Pivot Point S1 | 24.98 |
| Daily Pivot Point S2 | 24.76 |
| Daily Pivot Point S3 | 24.59 |
| Daily Pivot Point R1 | 25.37 |
| Daily Pivot Point R2 | 25.54 |
| Daily Pivot Point R3 | 25.76 |
[/s2If]
Join Our Telegram Group
")


