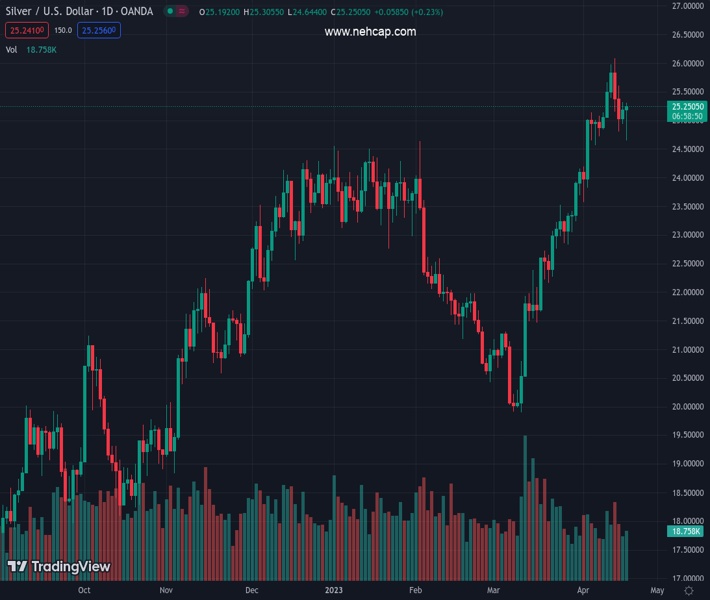
#XAGUSD @ 25.237 Sharp bounce in metals, boosted by a reversal of the US Dollar. (Pivot Orderbook analysis)
…
This is a premium post.
[s2If !current_user_can(access_s2member_level4)]Please register for PREMIUM VERSION HERE to read full post below containing analysis. In case of any error or you think you are not able to read the full post below, please email us at support#nehcap.com [lwa][/s2If] [s2If current_user_can(access_s2member_level4)]
- Sharp bounce in metals, boosted by a reversal of the US Dollar.
- XAG/USD bottomed at $24.63, lowest in two weeks, and is at $25.20.
- Next resistance for Silver is seen around $25.20/25.
The pair currently trades last at 25.237.
The previous day high was 25.32 while the previous day low was 24.93. The daily 38.2% Fib levels comes at 25.17, expected to provide support. Similarly, the daily 61.8% fib level is at 25.08, expected to provide support.
Silver reversed sharply rising 2.50% from the daily low. XAG/USD has turned positive and is testing daily highs near the $25.20/25 area. Just one hour ago, the price bottomed at $24.63, the lowest since April 6.
The rally in metals is gaining speed even as US yields rise and despite a negative opening in Wall Street. A decline of the US Dollar helped the intraday reversal in metals.
Gold also rose sharply during the last hours, gaining more than $20. XAU/USD is still down for the day, but off lows and back above $1,990/oz.
After the jump, XAG/USD tests a key short-term resistance around $25.20/25 again. A consolidation above would point to more gains, initially targeting the $25.60 zone. On the flip side, now $25.00 is again a support level. The downside seems limited as long as Silver stays above $24.75. A consolidation below should trigger more losses, with the next support at $24.20.
Technical Levels: Supports and Resistances
XAGUSD currently trading at 25.21 at the time of writing. Pair opened at 25.2 and is trading with a change of 0.04 % .
| Overview | Overview.1 | |
|---|---|---|
| 0 | Today last price | 25.21 |
| 1 | Today Daily Change | 0.01 |
| 2 | Today Daily Change % | 0.04 |
| 3 | Today daily open | 25.20 |
The pair remains strongly bullish on the daily timeframe. It trades above its 20 SMA @ 24.26, 50 SMA 22.57, 100 SMA @ 23.01 and 200 SMA @ 21.32.
| Trends | Trends.1 | |
|---|---|---|
| 0 | Daily SMA20 | 24.26 |
| 1 | Daily SMA50 | 22.57 |
| 2 | Daily SMA100 | 23.01 |
| 3 | Daily SMA200 | 21.32 |
The previous day high was 25.32 while the previous day low was 24.93. The daily 38.2% Fib levels comes at 25.17, expected to provide support. Similarly, the daily 61.8% fib level is at 25.08, expected to provide support.
Note the levels of interest below:
- Pivot support is noted at 24.98, 24.76, 24.59
- Pivot resistance is noted at 25.37, 25.54, 25.76
| Levels | Levels.1 |
|---|---|
| Previous Daily High | 25.32 |
| Previous Daily Low | 24.93 |
| Previous Weekly High | 26.09 |
| Previous Weekly Low | 24.72 |
| Previous Monthly High | 24.16 |
| Previous Monthly Low | 19.90 |
| Daily Fibonacci 38.2% | 25.17 |
| Daily Fibonacci 61.8% | 25.08 |
| Daily Pivot Point S1 | 24.98 |
| Daily Pivot Point S2 | 24.76 |
| Daily Pivot Point S3 | 24.59 |
| Daily Pivot Point R1 | 25.37 |
| Daily Pivot Point R2 | 25.54 |
| Daily Pivot Point R3 | 25.76 |
[/s2If]
Join Our Telegram Group
")


