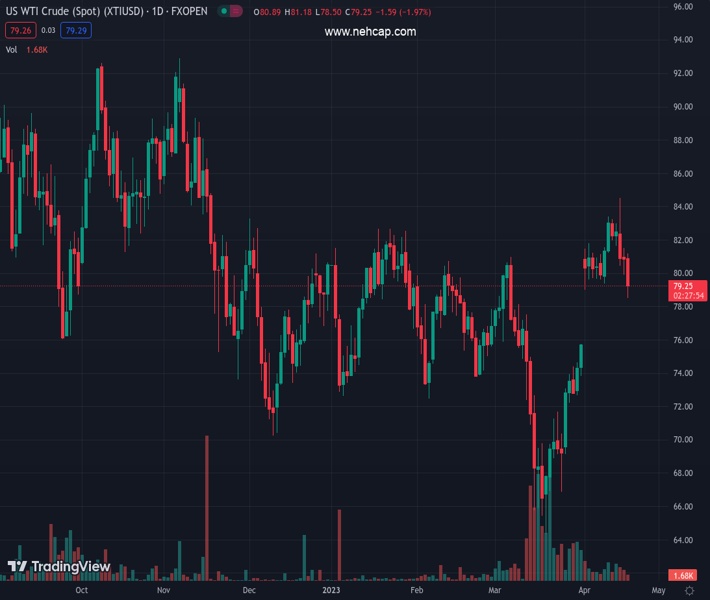
WTI is falling as the American Dollar remains bolstered by expectations for a Fed hike. (Pivot Orderbook analysis)
…
This is a premium post.
[s2If !current_user_can(access_s2member_level4)]Please register for PREMIUM VERSION HERE to read full post below containing analysis. In case of any error or you think you are not able to read the full post below, please email us at support#nehcap.com [lwa][/s2If] [s2If current_user_can(access_s2member_level4)]
- WTI is falling as the American Dollar remains bolstered by expectations for a Fed hike.
- US EIA’s 600k barrel increase had no impact on WTI price.
- WTI Price Analysis: Downside risks remain below $80.00; otherwise, oil prices will stay sideways.
The pair currently trades last at 79.36.
The previous day high was 81.51 while the previous day low was 79.91. The daily 38.2% Fib levels comes at 80.52, expected to provide resistance. Similarly, the daily 61.8% fib level is at 80.9, expected to provide resistance.
Western Texas Intermediate (WTI), the US crude oil benchmark, falls as the US Dollar (USD) strengthens due to speculations that the Fed will raise rates as it tries to tackle sticky inflation. Therefore, WTI is trading at $79.65 PB, down more than 1.50%.
The greenback continued to trade higher during the New York session. Federal Reserve hawkish commentary on Tuesday spurred a jump in US Treasury bond yields, which underpinned the US Dollar. Market participants getting ready for a 25 bps rate hike by the Fed pushed the American Dollar (USD) higher, as shown by the US Dollar Index gaining 0.22%, at 101.942.
The CME FedWatch Tool shows odds for a lift toward the 5.00%-5.25% threshold at an 85.4% chance for the Fed’s May meeting.
Consequently, the US 2-year Treasury bond yield, the most sensitive to short-term interest rate adjustments, is up six and a half bps at 4.267%, increasing demand for the US Dollar, thus making dollar-denominated commodities more expensive for foreign buyers.
Another reason for oil’s fall was the latest US Energy Information Administration report. The data revealed an inventory draw of 4.6 million barrels for April 14, a modest increase of 600,000 barrels compared to the last week’s 3.7 million builds.
Aside from this, China, the world’s biggest crude oil importer, reported uneven economic data, indicating a challenging economic recovery after the country dropped its COVID-19 policy.
WTI remains neutral to downward biased after trimming some of its gains generated by OPEC’s announcement of cutting its crude oil output by 1 million barrels around the beginning of April. Furthermore, WTI fell below the 200-day Exponential Moving Average (EMA) at $81.86, exacerbating a fall below the $80.00 PB barrier. For a bearish continuation, WTI must crack the $79.00 figure. Once done, the next demand area would be the confluence of the 20 and 100-day, around $78.48/62, followed by the $78.00 barrier. Conversely, WTI’s could continue to trade sideways if bulls reclaim $80.00.
Technical Levels: Supports and Resistances
XTIUSD currently trading at 79.36 at the time of writing. Pair opened at 80.89 and is trading with a change of -1.89 % .
| Overview | Overview.1 | |
|---|---|---|
| 0 | Today last price | 79.36 |
| 1 | Today Daily Change | -1.53 |
| 2 | Today Daily Change % | -1.89 |
| 3 | Today daily open | 80.89 |
The pair is trading above its 20 Daily moving average @ 77.07, above its 50 Daily moving average @ 76.41 , above its 100 Daily moving average @ 77.01 and below its 200 Daily moving average @ 82.39
| Trends | Trends.1 | |
|---|---|---|
| 0 | Daily SMA20 | 77.07 |
| 1 | Daily SMA50 | 76.41 |
| 2 | Daily SMA100 | 77.01 |
| 3 | Daily SMA200 | 82.39 |
The previous day high was 81.51 while the previous day low was 79.91. The daily 38.2% Fib levels comes at 80.52, expected to provide resistance. Similarly, the daily 61.8% fib level is at 80.9, expected to provide resistance.
Note the levels of interest below:
- Pivot support is noted at 80.03, 79.17, 78.43
- Pivot resistance is noted at 81.63, 82.37, 83.23
| Levels | Levels.1 |
|---|---|
| Previous Daily High | 81.51 |
| Previous Daily Low | 79.91 |
| Previous Weekly High | 83.40 |
| Previous Weekly Low | 79.40 |
| Previous Monthly High | 80.99 |
| Previous Monthly Low | 64.39 |
| Daily Fibonacci 38.2% | 80.52 |
| Daily Fibonacci 61.8% | 80.90 |
| Daily Pivot Point S1 | 80.03 |
| Daily Pivot Point S2 | 79.17 |
| Daily Pivot Point S3 | 78.43 |
| Daily Pivot Point R1 | 81.63 |
| Daily Pivot Point R2 | 82.37 |
| Daily Pivot Point R3 | 83.23 |
[/s2If]
Join Our Telegram Group
")


