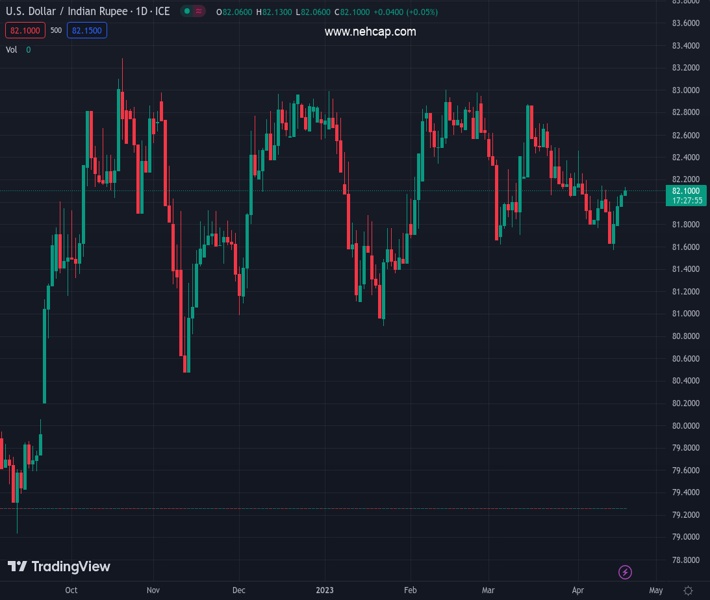
#USDINR @ 82.1200 has printed a fresh weekly high at 82.11 amid a recovery in the USD Index. (Pivot Orderbook analysis)
…
This is a premium post.
[s2If !current_user_can(access_s2member_level4)]Please register for PREMIUM VERSION HERE to read full post below containing analysis. In case of any error or you think you are not able to read the full post below, please email us at support#nehcap.com [lwa][/s2If] [s2If current_user_can(access_s2member_level4)]
- USD/INR has printed a fresh weekly high at 82.11 amid a recovery in the USD Index.
- The Fed is not expected to pause rate hikes sooner despite a deceleration in inflation and easing labor market conditions.
- The Indian Rupee is failing to show resilience despite the buying spree from FIIs.
The pair currently trades last at 82.1200.
The previous day high was 82.1286 while the previous day low was 81.9595. The daily 38.2% Fib levels comes at 82.064, expected to provide support. Similarly, the daily 61.8% fib level is at 82.0241, expected to provide support.
The USD/INR pair has printed a fresh weekly high at 82.11 in the opening session. The major has been fueled by a recovery move in the US Dollar Index (DXY) on expectations that one more rate hike by the Federal Reserve (Fed) is in pipeline to arrest sticky United States inflation swiftly.
The USD Index has rebounded after a correction to near 101.65. Also, US Treasury yields have been lifted by a recovery in the USD Index. Investors seem reluctant to invest in US government bonds as the Fed is not expected to pause its policy-tightening spell sooner despite a deceleration in inflationary pressures and easing labor market conditions. The 10-year US Treasury yields have climbed above 3.58%.
Meanwhile, S&P500 futures have extended losses as investors are cautious after poor quarterly earnings show from investment-banking firm Goldman Sachs and pharma-giant Johnson and Johnson (J&J), portraying a decline in the risk appetite of the market participants.
A power-pack action would be shown by the USD Index amid the release of the Fed’s Beige Book, which will provide the current economic prospects of 12 Fed districts. Any sort of improvement in economic activities, labor demand, and other economic indicators will cement the need for further rate hikes by the Fed to keep pressure on persistent inflation.
Meanwhile, Indian Rupee is failing to show resilience despite the buying spree from Foreign Institutional Investors (FIIs). The catalyst that is weighing pressure on the Indian rupee is the healthy demand forecast for oil. The street is confident that the Chinese economy is well on track for economic recovery after the release of upbeat Gross Domestic Product (GDP) and Retail Sales figures.
It is worth noting that India is one of the leading importers of oil in the world and an upward revision of oil demand will increase its prices and will impact the Indian rupee.
Technical Levels: Supports and Resistances
USDINR currently trading at 82.1285 at the time of writing. Pair opened at 82.1058 and is trading with a change of 0.03 % .
| Overview | Overview.1 | |
|---|---|---|
| 0 | Today last price | 82.1285 |
| 1 | Today Daily Change | 0.0227 |
| 2 | Today Daily Change % | 0.0300 |
| 3 | Today daily open | 82.1058 |
The pair is trading above its 20 Daily moving average @ 82.0777, below its 50 Daily moving average @ 82.3318 , below its 100 Daily moving average @ 82.2272 and above its 200 Daily moving average @ 81.49
| Trends | Trends.1 | |
|---|---|---|
| 0 | Daily SMA20 | 82.0777 |
| 1 | Daily SMA50 | 82.3318 |
| 2 | Daily SMA100 | 82.2272 |
| 3 | Daily SMA200 | 81.4900 |
The previous day high was 82.1286 while the previous day low was 81.9595. The daily 38.2% Fib levels comes at 82.064, expected to provide support. Similarly, the daily 61.8% fib level is at 82.0241, expected to provide support.
Note the levels of interest below:
- Pivot support is noted at 82.0006, 81.8956, 81.8316
- Pivot resistance is noted at 82.1697, 82.2336, 82.3387
| Levels | Levels.1 |
|---|---|
| Previous Daily High | 82.1286 |
| Previous Daily Low | 81.9595 |
| Previous Weekly High | 82.1600 |
| Previous Weekly Low | 81.5105 |
| Previous Monthly High | 83.0315 |
| Previous Monthly Low | 81.5120 |
| Daily Fibonacci 38.2% | 82.0640 |
| Daily Fibonacci 61.8% | 82.0241 |
| Daily Pivot Point S1 | 82.0006 |
| Daily Pivot Point S2 | 81.8956 |
| Daily Pivot Point S3 | 81.8316 |
| Daily Pivot Point R1 | 82.1697 |
| Daily Pivot Point R2 | 82.2336 |
| Daily Pivot Point R3 | 82.3387 |
[/s2If]
Join Our Telegram Group
")


