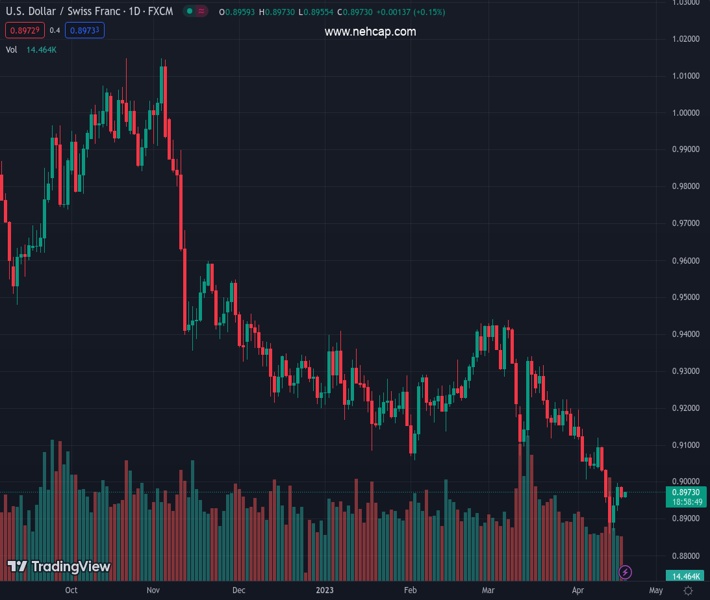
#USDCHF @ 0.89708 is making efforts for recovery after defending the critical support of 0.8960. (Pivot Orderbook analysis)
…
This is a premium post.
[s2If !current_user_can(access_s2member_level4)]Please register for PREMIUM VERSION HERE to read full post below containing analysis. In case of any error or you think you are not able to read the full post below, please email us at support#nehcap.com [lwa][/s2If] [s2If current_user_can(access_s2member_level4)]
- USD/CHF is making efforts for recovery after defending the critical support of 0.8960.
- S&P500 futures have shown nominal losses in Asia amid anxiety over earnings data.
- Fed Bostic favored one more rate hike and then holding them above 5% for some time.
The pair currently trades last at 0.89708.
The previous day high was 0.8989 while the previous day low was 0.8955. The daily 38.2% Fib levels comes at 0.8968, expected to provide support. Similarly, the daily 61.8% fib level is at 0.8976, expected to provide resistance.
The USD/CHF pair is eyeing a recovery after building a base around 0.8960 in the Asian session. The Swiss Franc asset has been defending the aforementioned support for the past two trading sessions. An attempt of recovery by the US Dollar Index (DXY) after correcting to near 101.65 has infused some strength in the Swiss Franc asset.
S&P500 futures have shown nominal losses in Asia amid anxiety over earnings data, portraying a cautionary market mood. The USD Index has rebounded above 101.70 and is expected to add gains ahead amid deepening hawkish Federal Reserve (Fed) bets.
Atlanta Fed Bank President Raphael Bostic said he favors raising interest rates one more time and then holding them above 5% for some time to curb inflation that remains too high, as reported by Bloomberg.
For further guidance, investors are awaiting the release of the Fed’s Beige Book, which will convey the current economic situation of 12 Fed districts.
USD/CHF has sensed barricades at 23.6% Fibonacci retracement (placed from March 08 high at 0.9439 to April 13 low at 0.8860) around 0.9000 on a two-hour scale. The recovery move by the Swiss Franc asset will get strengthened if it manages to climb above the 23.6% Fibo retracement.
The 20-and 50-period Exponential Moving Averages (EMAs) are on the verge of delivering a bullish crossover around 0.8966.
Meanwhile, the Relative Strength Index (RSI) (14) is making efforts for shifting its oscillation in the bullish range of 60.00-80.00.
Should the asset decisively breaks above the 23.6% Fibo retracement around 0.9000, US Dollar bulls will drive the asset towards April 07 low at 0.9034 followed by 38.6% Fibo retracement plotted at 0.9082.
Alternatively, a downside move below April 17 low at 0.8922 will drag the asset toward April 13 low at 0.8860. A slippage below the latter will expose the asset to the round-level support at 0.8800.
Technical Levels: Supports and Resistances
USDCHF currently trading at 0.8966 at the time of writing. Pair opened at 0.8962 and is trading with a change of 0.04 % .
| Overview | Overview.1 | |
|---|---|---|
| 0 | Today last price | 0.8966 |
| 1 | Today Daily Change | 0.0004 |
| 2 | Today Daily Change % | 0.0400 |
| 3 | Today daily open | 0.8962 |
The pair remains strongly bearish on the daily time frame. It trades below the 20 SMA @ 0.9079, 50 SMA 0.9206, 100 SMA @ 0.9241 and 200 SMA @ 0.948.
| Trends | Trends.1 | |
|---|---|---|
| 0 | Daily SMA20 | 0.9079 |
| 1 | Daily SMA50 | 0.9206 |
| 2 | Daily SMA100 | 0.9241 |
| 3 | Daily SMA200 | 0.9480 |
The previous day high was 0.8989 while the previous day low was 0.8955. The daily 38.2% Fib levels comes at 0.8968, expected to provide support. Similarly, the daily 61.8% fib level is at 0.8976, expected to provide resistance.
Note the levels of interest below:
- Pivot support is noted at 0.8948, 0.8934, 0.8914
- Pivot resistance is noted at 0.8982, 0.9002, 0.9016
| Levels | Levels.1 |
|---|---|
| Previous Daily High | 0.8989 |
| Previous Daily Low | 0.8955 |
| Previous Weekly High | 0.9114 |
| Previous Weekly Low | 0.8860 |
| Previous Monthly High | 0.9440 |
| Previous Monthly Low | 0.9072 |
| Daily Fibonacci 38.2% | 0.8968 |
| Daily Fibonacci 61.8% | 0.8976 |
| Daily Pivot Point S1 | 0.8948 |
| Daily Pivot Point S2 | 0.8934 |
| Daily Pivot Point S3 | 0.8914 |
| Daily Pivot Point R1 | 0.8982 |
| Daily Pivot Point R2 | 0.9002 |
| Daily Pivot Point R3 | 0.9016 |
[/s2If]
Join Our Telegram Group
")


