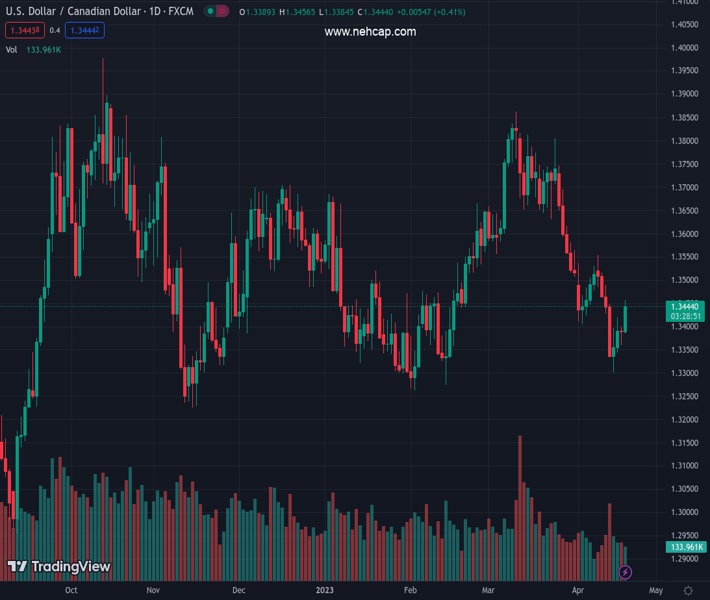
#USDCAD @ 1.34444 climbs, bolstered by elevated US Treasury bond yields, aiming for a daily close above 1.3450. (Pivot Orderbook analysis)
…
This is a premium post.
[s2If !current_user_can(access_s2member_level4)]Please register for PREMIUM VERSION HERE to read full post below containing analysis. In case of any error or you think you are not able to read the full post below, please email us at support#nehcap.com [lwa][/s2If] [s2If current_user_can(access_s2member_level4)]
- USD/CAD climbs, bolstered by elevated US Treasury bond yields, aiming for a daily close above 1.3450.
- The USD/CAD bearish bias will resume below 1.3400, as sellers would eye the 200-DMA.
The pair currently trades last at 1.34444.
The previous day high was 1.34 while the previous day low was 1.336. The daily 38.2% Fib levels comes at 1.3375, expected to provide support. Similarly, the daily 61.8% fib level is at 1.3384, expected to provide support.
USD/CAD climbs in the mid-North American session and tests a six-month-old resistance trendline that passes at around 1.3440. Though the USD/CAD bias remains neutral-to-downward biased, it could shift neutral if the pair reclaims the 100-day Exponential Moving Average (EMA). At the time of writing, the USD/CAD is trading at 1.3444 after reaching a low of 1.3384.
Given the backdrop, the USD/CAD could continue to rally and test the 20-day EMA at 1.3483 in the near term, which will immediately expose the 100-day EMA at 1.3500. Once that psychological resistance level is cleared, the bias shifts to neutral. A breach of the latter and the USD/CAD can test the 50-day EMA at 1.3525 before aiming for the 1.3600 figure.
Conversely, a USD/CAD bearish resumption will happen if the latest leg-up struggles to crack 1.3450. If that scenario plays out, coupled with the Relative Strength Index (RSI) staying in bearish territory, the USD/CAD could re-test 1.3400, followed by the 200-day EMA at 1.3378. A break below will turn the USD/CAD pair bearish and open the door to test the YTD low at 1.3262.
Technical Levels: Supports and Resistances
USDCAD currently trading at 1.3446 at the time of writing. Pair opened at 1.339 and is trading with a change of 0.42 % .
| Overview | Overview.1 | |
|---|---|---|
| 0 | Today last price | 1.3446 |
| 1 | Today Daily Change | 0.0056 |
| 2 | Today Daily Change % | 0.4200 |
| 3 | Today daily open | 1.3390 |
The pair is trading below its 20 Daily moving average @ 1.3515, below its 50 Daily moving average @ 1.3562 , below its 100 Daily moving average @ 1.3528 and above its 200 Daily moving average @ 1.3405
| Trends | Trends.1 | |
|---|---|---|
| 0 | Daily SMA20 | 1.3515 |
| 1 | Daily SMA50 | 1.3562 |
| 2 | Daily SMA100 | 1.3528 |
| 3 | Daily SMA200 | 1.3405 |
The previous day high was 1.34 while the previous day low was 1.336. The daily 38.2% Fib levels comes at 1.3375, expected to provide support. Similarly, the daily 61.8% fib level is at 1.3384, expected to provide support.
Note the levels of interest below:
- Pivot support is noted at 1.3367, 1.3343, 1.3327
- Pivot resistance is noted at 1.3406, 1.3423, 1.3446
| Levels | Levels.1 |
|---|---|
| Previous Daily High | 1.3400 |
| Previous Daily Low | 1.3360 |
| Previous Weekly High | 1.3554 |
| Previous Weekly Low | 1.3301 |
| Previous Monthly High | 1.3862 |
| Previous Monthly Low | 1.3508 |
| Daily Fibonacci 38.2% | 1.3375 |
| Daily Fibonacci 61.8% | 1.3384 |
| Daily Pivot Point S1 | 1.3367 |
| Daily Pivot Point S2 | 1.3343 |
| Daily Pivot Point S3 | 1.3327 |
| Daily Pivot Point R1 | 1.3406 |
| Daily Pivot Point R2 | 1.3423 |
| Daily Pivot Point R3 | 1.3446 |
[/s2If]
Join Our Telegram Group
")


