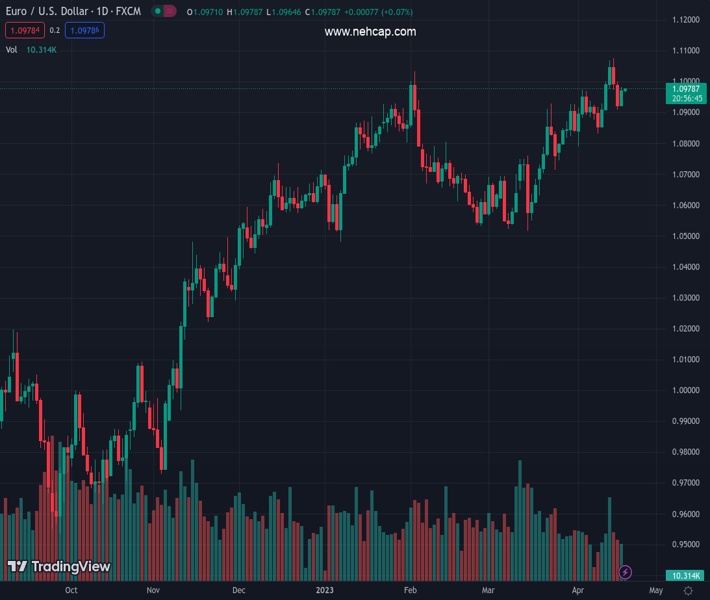
#EURUSD @ 1.09761 is expected to show a steep bullish momentum after breaking above the 1.1000 resistance. (Pivot Orderbook analysis)
…
This is a premium post.
[s2If !current_user_can(access_s2member_level4)]Please register for PREMIUM VERSION HERE to read full post below containing analysis. In case of any error or you think you are not able to read the full post below, please email us at support#nehcap.com [lwa][/s2If] [s2If current_user_can(access_s2member_level4)]
- EUR/USD is expected to show a steep bullish momentum after breaking above the 1.1000 resistance.
- The Euro is struggling to find any direction as investors are divided about the pace of hiking rates by the ECB.
- EUR/USD showed a confident reversal after dropping to near the upward-sloping trendline plotted from 1.0714.
The pair currently trades last at 1.09761.
The previous day high was 1.1 while the previous day low was 1.0909. The daily 38.2% Fib levels comes at 1.0944, expected to provide support. Similarly, the daily 61.8% fib level is at 1.0965, expected to provide support.
The EUR/USD pair is displaying a sideways auction below 1.0980 in the early Tokyo session. The major currency pair displayed a sharp rebound on Tuesday but failed to extend further. The sideways performance in the shared currency pair was the outcome of the lackluster US Dollar Index (DXY). The USD Index got rangebound after a corrective move below 101.80.
S&P500 futures are showing mild losses in early Asia after a volatile session. A stock-specific action was observed in US equities as giants like Goldman Sachs and Johnson & Johnson failed to match forecasted earnings.
The Euro is struggling to find any direction as investors are divided about the pace of hiking rates by the European Central Bank (ECB) in its May monetary policy meeting. One school of thought is still not convinced that ECB President Christine Lagarde will trim the pace of policy-tightening to 25 basis points (bps) in times when Eurozone inflation seems critically persistent.
On a two-hour scale, EUR/USD showed a confident reversal after dropping to near the upward-sloping trendline plotted from March 24 low at 1.0714 on a two-hour scale. The major currency pair is approaching the horizontal resistance plotted from April 14 high at 1.1075.
The Euro has pushed the asset above the 20-period Exponential Moving Average (EMA) at 1.0964, which indicates that the short-term trend has turned bullish.
Also, the Relative Strength Index (RSI) (14) has shifted into the 40.00-60.00 range from the bearish range of 20.00-40.00, which indicates that the shared continent currency is not bearish anymore.
A break above the psychological resistance of 1.1000 will drive the asset to a fresh annual high at 1.1068, followed by the round-level resistance at 1.1100.
On the flip side, a decisive break below April 12 low at 1.0915 will drag the asset towards April 10 low at 1.0837 and April 03 low at 1.0788.
Technical Levels: Supports and Resistances
EURUSD currently trading at 1.0975 at the time of writing. Pair opened at 1.0925 and is trading with a change of 0.46 % .
| Overview | Overview.1 | |
|---|---|---|
| 0 | Today last price | 1.0975 |
| 1 | Today Daily Change | 0.0050 |
| 2 | Today Daily Change % | 0.4600 |
| 3 | Today daily open | 1.0925 |
The pair remains strongly bullish on the daily timeframe. It trades above its 20 SMA @ 1.0888, 50 SMA 1.0747, 100 SMA @ 1.0716 and 200 SMA @ 1.0375.
| Trends | Trends.1 | |
|---|---|---|
| 0 | Daily SMA20 | 1.0888 |
| 1 | Daily SMA50 | 1.0747 |
| 2 | Daily SMA100 | 1.0716 |
| 3 | Daily SMA200 | 1.0375 |
The previous day high was 1.1 while the previous day low was 1.0909. The daily 38.2% Fib levels comes at 1.0944, expected to provide support. Similarly, the daily 61.8% fib level is at 1.0965, expected to provide support.
Note the levels of interest below:
- Pivot support is noted at 1.089, 1.0854, 1.0799
- Pivot resistance is noted at 1.098, 1.1035, 1.1071
| Levels | Levels.1 |
|---|---|
| Previous Daily High | 1.1000 |
| Previous Daily Low | 1.0909 |
| Previous Weekly High | 1.1076 |
| Previous Weekly Low | 1.0837 |
| Previous Monthly High | 1.0930 |
| Previous Monthly Low | 1.0516 |
| Daily Fibonacci 38.2% | 1.0944 |
| Daily Fibonacci 61.8% | 1.0965 |
| Daily Pivot Point S1 | 1.0890 |
| Daily Pivot Point S2 | 1.0854 |
| Daily Pivot Point S3 | 1.0799 |
| Daily Pivot Point R1 | 1.0980 |
| Daily Pivot Point R2 | 1.1035 |
| Daily Pivot Point R3 | 1.1071 |
[/s2If]
Join Our Telegram Group
")


