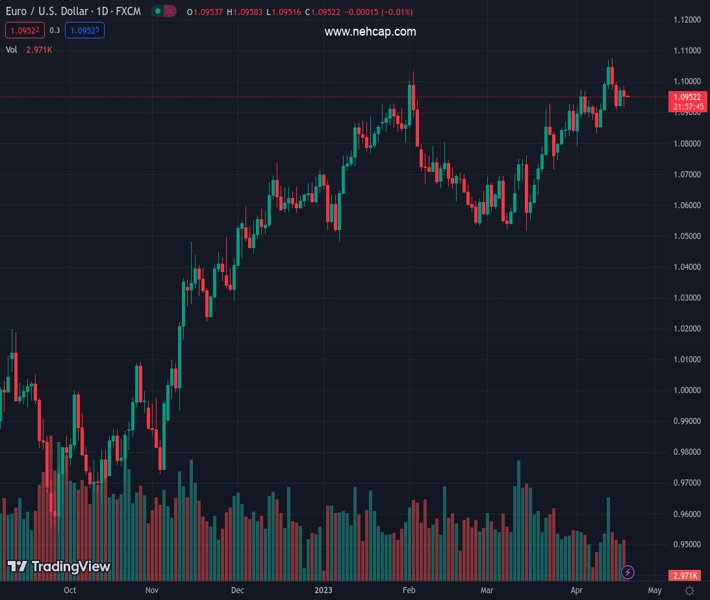
#EURUSD @ 1.09531 fades bounce off 100-SMA while retreating from 21-SMA, sidelined of late., @nehcap view: Further downside expected (Pivot Orderbook analysis)
…
This is a premium post.
[s2If !current_user_can(access_s2member_level4)]Please register for PREMIUM VERSION HERE to read full post below containing analysis. In case of any error or you think you are not able to read the full post below, please email us at support#nehcap.com [lwa][/s2If] [s2If current_user_can(access_s2member_level4)]
- EUR/USD fades bounce off 100-SMA while retreating from 21-SMA, sidelined of late.
- Sluggish MACD, steady RSI advocates further volatility ahead.
- One-month-old ascending support line holds the gate for Euro bear’s entry.
- Repeated failures to cross short-term key hurdle lure sellers, bulls need validation from one-week-old horizontal resistance area.
The pair currently trades last at 1.09531.
The previous day high was 1.0983 while the previous day low was 1.0922. The daily 38.2% Fib levels comes at 1.096, expected to provide resistance. Similarly, the daily 61.8% fib level is at 1.0946, expected to provide support.
EUR/USD treads water around 1.0950 amid the early hours of Thursday’s Asian session. In doing so, the Euro pair fades the corrective bounce off the 100-bar SMA marked a few hours back while retreating from the 21-SMA.
With this, the Euro pair marked repeated failures in crossing the 21-SMA in the current week, which in turn joins the steady RSI (14) line and sluggish MACD signals, mostly bearish, to keep the sellers hopeful.
However, the 100-SMA support of 1.0920 isn’t the key to the EUR/USD pair’s south run as an upward-sloping support line from late March, close to 1.0910 is a crucial challenge for the bears to tackle before taking control.
Following that, a slump toward the April 10 swing low of around 1.0835 can’t be ruled out.
However, the monthly low of 1.0788 and the 61.8% Fibonacci retracement level of the pair’s March-April upside, near 1.0730 could challenge the pair’s further downside afterward.
Meanwhile, recovery moves can’t be confirmed on an upside break of the 21-SMA hurdle of near 1.0965 as a one-week-old horizontal resistance area, close to the 1.1000 psychological magnet, will be crucial for EUR/USD buyers to cross for fresh power.
In a case where the EUR/USD bulls remain in control past 1.1000, the latest peak surrounding 1.1075 will be in the spotlight.
Trend: Further downside expected
Technical Levels: Supports and Resistances
EURUSD currently trading at 1.0956 at the time of writing. Pair opened at 1.0972 and is trading with a change of -0.15% % .
| Overview | Overview.1 | |
|---|---|---|
| 0 | Today last price | 1.0956 |
| 1 | Today Daily Change | -0.0016 |
| 2 | Today Daily Change % | -0.15% |
| 3 | Today daily open | 1.0972 |
The pair remains strongly bullish on the daily timeframe. It trades above its 20 SMA @ 1.0898, 50 SMA 1.0751, 100 SMA @ 1.0722 and 200 SMA @ 1.0379.
| Trends | Trends.1 | |
|---|---|---|
| 0 | Daily SMA20 | 1.0898 |
| 1 | Daily SMA50 | 1.0751 |
| 2 | Daily SMA100 | 1.0722 |
| 3 | Daily SMA200 | 1.0379 |
The previous day high was 1.0983 while the previous day low was 1.0922. The daily 38.2% Fib levels comes at 1.096, expected to provide resistance. Similarly, the daily 61.8% fib level is at 1.0946, expected to provide support.
Note the levels of interest below:
- Pivot support is noted at 1.0935, 1.0899, 1.0875
- Pivot resistance is noted at 1.0996, 1.102, 1.1057
| Levels | Levels.1 |
|---|---|
| Previous Daily High | 1.0983 |
| Previous Daily Low | 1.0922 |
| Previous Weekly High | 1.1076 |
| Previous Weekly Low | 1.0837 |
| Previous Monthly High | 1.0930 |
| Previous Monthly Low | 1.0516 |
| Daily Fibonacci 38.2% | 1.0960 |
| Daily Fibonacci 61.8% | 1.0946 |
| Daily Pivot Point S1 | 1.0935 |
| Daily Pivot Point S2 | 1.0899 |
| Daily Pivot Point S3 | 1.0875 |
| Daily Pivot Point R1 | 1.0996 |
| Daily Pivot Point R2 | 1.1020 |
| Daily Pivot Point R3 | 1.1057 |
[/s2If]
Join Our Telegram Group
")


