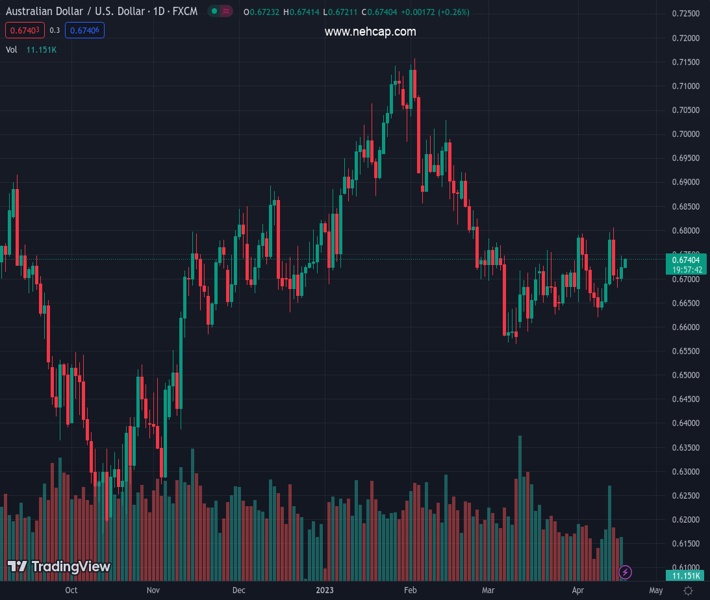
#AUDUSD @ 0.67375 has shown a recovery move amid a soft performance by the USD Index. (Pivot Orderbook analysis)
…
This is a premium post.
[s2If !current_user_can(access_s2member_level4)]Please register for PREMIUM VERSION HERE to read full post below containing analysis. In case of any error or you think you are not able to read the full post below, please email us at support#nehcap.com [lwa][/s2If] [s2If current_user_can(access_s2member_level4)]
- AUD/USD has shown a recovery move amid a soft performance by the USD Index.
- The RBA minutes showed that policymakers were actively discussing a rate hike but concluded the meeting with steady interest rates.
- AUD/USD is auctioning in an Inverted Flag that displays a long consolidation and is followed by a breakdown.
The pair currently trades last at 0.67375.
The previous day high was 0.6748 while the previous day low was 0.6692. The daily 38.2% Fib levels comes at 0.6726, expected to provide support. Similarly, the daily 61.8% fib level is at 0.6714, expected to provide support.
The AUD/USD pair has rebounded firmly to near 0.6740 after a gradual correction. The Aussie asset witnessed stellar buying interest amid the soft US Dollar and an upside revision in forecast for China’s growth rate. The US Dollar Index (DXY) is showing a quiet action ahead of the release of the Federal Reserve’s (Fed) Beige Book.
The Australian Dollar remained in action on Tuesday after the release of the Reserve Bank of Australia (RBA) minutes. The RBA minutes showed that policymakers were actively discussing a rate hike but concluded the meeting with a decision of keeping rates steady at 3.6%. RBA Governor Philip Lowe cited that the central bank needs some time to gather information for further action.
Forecasting agencies were gung ho for raising China’s Gross Domestic Product (GDP) forecast after an upbeat quarterly performance. Going forward, the interest rate decision by the People’s Bank of China (PBoC) will be the key highlight. It is worth noting that Australia is the leading trading partner of China and upbeat Chinese prospects would support the Australian Dollar.
AUD/USD is auctioning in an Inverted Flag chart pattern on an hourly scale. An Inverted Flag is a trend-following pattern which displays a long consolidation that is followed by a breakdown. Usually, the consolidation phase of the chart pattern serves as an inventory adjustment in which those participants initiate shorts, which prefer to enter an auction after the establishment of a bearish bias and current sellers add more positions.
The 20-period Exponential Moving Average (EMA) at 0.6720 is overlapping the asset price, indicating a lackluster performance.
Meanwhile, the Relative Strength Index (RSI) (14) is hovering in the 40.00-60.00 range, signaling an absence of a potential trigger.
Going forward, a break above March 22 high at 0.6759 will drive the asset toward April 03 high at 0.6693. A breach above the latter would further drive the asset to February 06 low at 0.6855.
In an alternative scenario, more weakness will be observed on a breakdown of April 10 low at 0.6620, which will expose the Aussie asset to March 10 low at 0.6564 followed by the round-level support at 0.6500.
Technical Levels: Supports and Resistances
AUDUSD currently trading at 0.6736 at the time of writing. Pair opened at 0.6724 and is trading with a change of 0.18 % .
| Overview | Overview.1 | |
|---|---|---|
| 0 | Today last price | 0.6736 |
| 1 | Today Daily Change | 0.0012 |
| 2 | Today Daily Change % | 0.1800 |
| 3 | Today daily open | 0.6724 |
The pair is trading above its 20 Daily moving average @ 0.6698, below its 50 Daily moving average @ 0.674 , below its 100 Daily moving average @ 0.6801 and below its 200 Daily moving average @ 0.6744
| Trends | Trends.1 | |
|---|---|---|
| 0 | Daily SMA20 | 0.6698 |
| 1 | Daily SMA50 | 0.6740 |
| 2 | Daily SMA100 | 0.6801 |
| 3 | Daily SMA200 | 0.6744 |
The previous day high was 0.6748 while the previous day low was 0.6692. The daily 38.2% Fib levels comes at 0.6726, expected to provide support. Similarly, the daily 61.8% fib level is at 0.6714, expected to provide support.
Note the levels of interest below:
- Pivot support is noted at 0.6695, 0.6666, 0.664
- Pivot resistance is noted at 0.675, 0.6776, 0.6805
| Levels | Levels.1 |
|---|---|
| Previous Daily High | 0.6748 |
| Previous Daily Low | 0.6692 |
| Previous Weekly High | 0.6806 |
| Previous Weekly Low | 0.6620 |
| Previous Monthly High | 0.6784 |
| Previous Monthly Low | 0.6564 |
| Daily Fibonacci 38.2% | 0.6726 |
| Daily Fibonacci 61.8% | 0.6714 |
| Daily Pivot Point S1 | 0.6695 |
| Daily Pivot Point S2 | 0.6666 |
| Daily Pivot Point S3 | 0.6640 |
| Daily Pivot Point R1 | 0.6750 |
| Daily Pivot Point R2 | 0.6776 |
| Daily Pivot Point R3 | 0.6805 |
[/s2If]
Join Our Telegram Group
")


