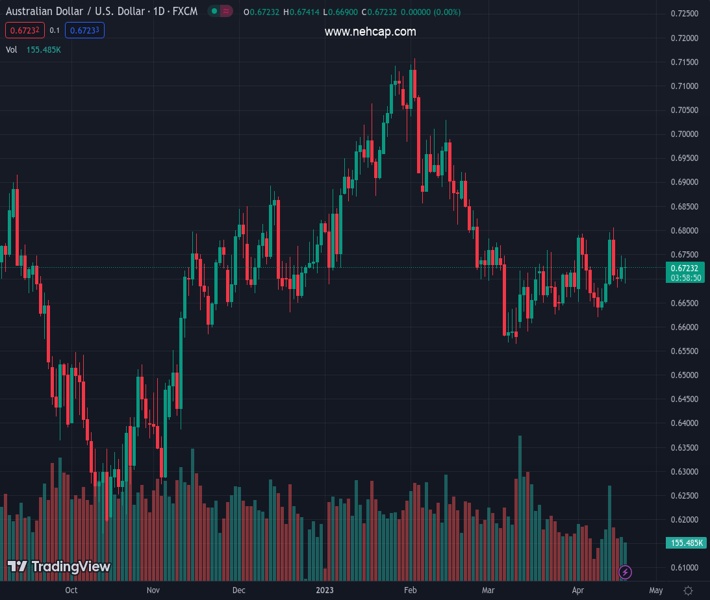
#AUDUSD @ 0.67218 The US Dollar got bolstered on elevated US T-bond yields as traders brace for a Fed hike in May. (Pivot Orderbook analysis)
…
This is a premium post.
[s2If !current_user_can(access_s2member_level4)]Please register for PREMIUM VERSION HERE to read full post below containing analysis. In case of any error or you think you are not able to read the full post below, please email us at support#nehcap.com [lwa][/s2If] [s2If current_user_can(access_s2member_level4)]
- The US Dollar got bolstered on elevated US T-bond yields as traders brace for a Fed hike in May.
- The Australian Dollar benefits from positive China growth report; RBA’s hawkish minutes.
- AUD/USD Price Analysis: Neutral-downwards, which might test YTD lows below 0.6700.
The pair currently trades last at 0.67218.
The previous day high was 0.6748 while the previous day low was 0.6692. The daily 38.2% Fib levels comes at 0.6726, expected to provide resistance. Similarly, the daily 61.8% fib level is at 0.6714, expected to provide support.
AUD/USD retreats after testing the 100-day Exponential Moving Average (EMA), due to sentiment shifting sour on expectations that the Federal Reserve (Fed) can continue to tighten monetary conditions. Hence, US Treasury bond yields remain climbing. The AUD/USD is trading at 0.6717 after hitting a high of 0.6741.
The US Dollar (USD) is underpinned by elevated US T-bond yields. Compared to Tuesday’s close, the US 2-year Treasury note is yielding 4.265%, gains six and a half basis points. For the upcoming May meeting, traders expect a 25 bps rate hike, as the CME FedWatch Tool shows, with odds at 82.8%. A slew of Federal Reserve officials pushed back against a possible recession in the United States (US) and commented that inflation remains hot and the labor market is too tight. However, they diverged on the peak for the Federal Funds Rate.
Regarding monetary policy, Bostic favors one more hike and a pause, while Bullard expects an additional 50 bps of tightening to lift rates to the 5.50%-5.75% range.
Meanwhile, the US Dollar Index (DXY), a measure of the buck’s value against its peers, climbs 0.22%, at 101.941.
On the Australian front, a light economic calendar kept AUD/USD traders leaning on recent data. The latest growth report about China’s economy maintained the Australian Dollar (AUD) from falling further against the US Dollar. The RBA’s latest monetary policy minutes also revealed that the board discussed a 25 bps rate hike, but rates were held steady at 3.60%. Notably, the minutes indicated concerns about high inflation and a tight labor market, leaving the possibility of further tightening on the table.
Even though the AUD/USD fall was capped at the 20-day EMA at 0.6706, the pair remains neutral to downward biased. For a bullish resumption, the AUD/USD must break the 50-day EMA at 0.6734, which will pave the way toward the 100-day EMA at 0.6756. Break above, and the 0.6800 psychological level would be up for grabs. On the other hand, if AUD/USD drops below 0.6700, expect a bearish continuation. The first support to be tested would be the weekly low of 0.6681, followed by a one-and-a-half-month upslope support trendline at 0.6630. Break below, and 0.6600 will be next.
Technical Levels: Supports and Resistances
AUDUSD currently trading at 0.6716 at the time of writing. Pair opened at 0.6724 and is trading with a change of -0.12 % .
| Overview | Overview.1 | |
|---|---|---|
| 0 | Today last price | 0.6716 |
| 1 | Today Daily Change | -0.0008 |
| 2 | Today Daily Change % | -0.1200 |
| 3 | Today daily open | 0.6724 |
The pair is trading above its 20 Daily moving average @ 0.6698, below its 50 Daily moving average @ 0.674 , below its 100 Daily moving average @ 0.6801 and below its 200 Daily moving average @ 0.6744
| Trends | Trends.1 | |
|---|---|---|
| 0 | Daily SMA20 | 0.6698 |
| 1 | Daily SMA50 | 0.6740 |
| 2 | Daily SMA100 | 0.6801 |
| 3 | Daily SMA200 | 0.6744 |
The previous day high was 0.6748 while the previous day low was 0.6692. The daily 38.2% Fib levels comes at 0.6726, expected to provide resistance. Similarly, the daily 61.8% fib level is at 0.6714, expected to provide support.
Note the levels of interest below:
- Pivot support is noted at 0.6695, 0.6666, 0.664
- Pivot resistance is noted at 0.675, 0.6776, 0.6805
| Levels | Levels.1 |
|---|---|
| Previous Daily High | 0.6748 |
| Previous Daily Low | 0.6692 |
| Previous Weekly High | 0.6806 |
| Previous Weekly Low | 0.6620 |
| Previous Monthly High | 0.6784 |
| Previous Monthly Low | 0.6564 |
| Daily Fibonacci 38.2% | 0.6726 |
| Daily Fibonacci 61.8% | 0.6714 |
| Daily Pivot Point S1 | 0.6695 |
| Daily Pivot Point S2 | 0.6666 |
| Daily Pivot Point S3 | 0.6640 |
| Daily Pivot Point R1 | 0.6750 |
| Daily Pivot Point R2 | 0.6776 |
| Daily Pivot Point R3 | 0.6805 |
[/s2If]
Join Our Telegram Group
")


