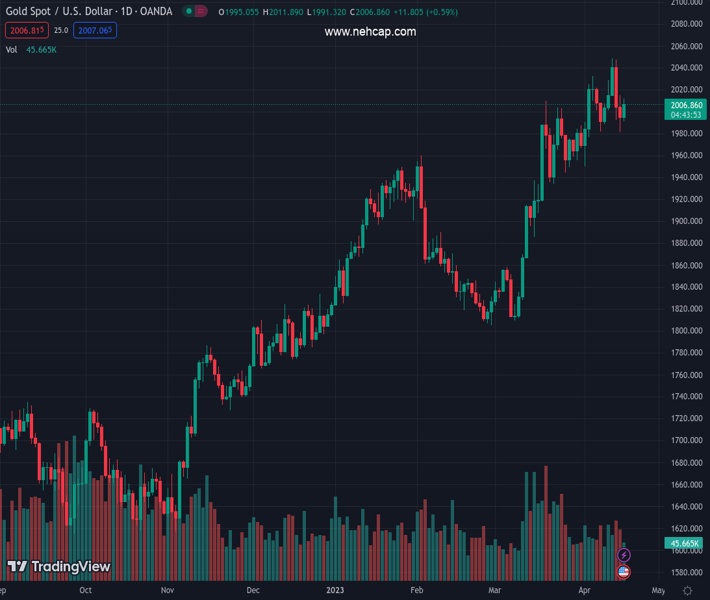
#XAUUSD @ 2,006.96 Gold rises after a sharp correction on a quiet day. (Pivot Orderbook analysis)
…
This is a premium post.
[s2If !current_user_can(access_s2member_level4)]Please register for PREMIUM VERSION HERE to read full post below containing analysis. In case of any error or you think you are not able to read the full post below, please email us at support#nehcap.com [lwa][/s2If] [s2If current_user_can(access_s2member_level4)]
- Gold rises after a sharp correction on a quiet day.
- XAU/USD found support above the 20-day SMA.
- US Dollar falls across the board ending a two-day rally.
The pair currently trades last at 2006.96.
The previous day high was 2015.13 while the previous day low was 1981.23. The daily 38.2% Fib levels comes at 1994.18, expected to provide support. Similarly, the daily 61.8% fib level is at 2002.18, expected to provide support.
Gold price rose $2,011/oz after the beginning of the American session, reaching a fresh daily high. The yellow metal remains near the high, supported by a weaker US Dollar.
The US Dollar Index is falling by 0.30%, back under 102.00 while US Treasury yields are little changed. Economic data from the US came in mixed. Housing Starts declined to 1.42 million in March, above the 1.4 million markets consensus, but Building Permits fell to 1.41 million against the consensus of 1.5 million.
On a quiet session, recently, XAU/USD spiked down to $1,991 and then rebounded to the $2,010 area where it is trading. It is moving with a bullish intraday bias, still within Monday’s price range.
Federal Reserve expectations are little change. Markets participants continue to see a rate hike in May as the most likely scenario and one rate cut before year-end as possible. The rally in Gold lost momentum during the last days as investors pared bets for deep rate cuts.
In the daily chart, Gold found support above the 20-period Simple Moving Average (SMA). The trend is still up. Above $2,025, more gains seem likely, and while below, a consolidation between that area and the 20-SMA could take place.
A daily close below $1,990 should keep the door open to an extension of the retreat with key support levels seen at $1,975 and $1,955.
Technical Levels: Supports and Resistances
XAUUSD currently trading at 2008.31 at the time of writing. Pair opened at 1995.16 and is trading with a change of 0.66 % .
| Overview | Overview.1 | |
|---|---|---|
| 0 | Today last price | 2008.31 |
| 1 | Today Daily Change | 13.15 |
| 2 | Today Daily Change % | 0.66 |
| 3 | Today daily open | 1995.16 |
The pair remains strongly bullish on the daily timeframe. It trades above its 20 SMA @ 1989.4, 50 SMA 1909.64, 100 SMA @ 1877.84 and 200 SMA @ 1794.96.
| Trends | Trends.1 | |
|---|---|---|
| 0 | Daily SMA20 | 1989.40 |
| 1 | Daily SMA50 | 1909.64 |
| 2 | Daily SMA100 | 1877.84 |
| 3 | Daily SMA200 | 1794.96 |
The previous day high was 2015.13 while the previous day low was 1981.23. The daily 38.2% Fib levels comes at 1994.18, expected to provide support. Similarly, the daily 61.8% fib level is at 2002.18, expected to provide support.
Note the levels of interest below:
- Pivot support is noted at 1979.22, 1963.27, 1945.32
- Pivot resistance is noted at 2013.12, 2031.07, 2047.02
| Levels | Levels.1 |
|---|---|
| Previous Daily High | 2015.13 |
| Previous Daily Low | 1981.23 |
| Previous Weekly High | 2048.75 |
| Previous Weekly Low | 1986.28 |
| Previous Monthly High | 2009.88 |
| Previous Monthly Low | 1809.46 |
| Daily Fibonacci 38.2% | 1994.18 |
| Daily Fibonacci 61.8% | 2002.18 |
| Daily Pivot Point S1 | 1979.22 |
| Daily Pivot Point S2 | 1963.27 |
| Daily Pivot Point S3 | 1945.32 |
| Daily Pivot Point R1 | 2013.12 |
| Daily Pivot Point R2 | 2031.07 |
| Daily Pivot Point R3 | 2047.02 |
[/s2If]
Join Our Telegram Group
")


