#XAUUSD @ 2,003.74 Gold price edges higher on Tuesday, albeit the intraday uptick lacks follow-through. (Pivot Orderbook analysis)
…
This is a premium post.
[s2If !current_user_can(access_s2member_level4)]Please register for PREMIUM VERSION HERE to read full post below containing analysis. In case of any error or you think you are not able to read the full post below, please email us at support#nehcap.com [lwa][/s2If] [s2If current_user_can(access_s2member_level4)]
- Gold price edges higher on Tuesday, albeit the intraday uptick lacks follow-through.
- The emergence of fresh selling around the US Dollar lends support to the XAU/USD.
- Bets for more Fed rate hikes keep the US bond yields elevated and cap the upside.
The pair currently trades last at 2003.74.
The previous day high was 2015.13 while the previous day low was 1981.23. The daily 38.2% Fib levels comes at 1994.18, expected to provide support. Similarly, the daily 61.8% fib level is at 2002.18, expected to provide support.
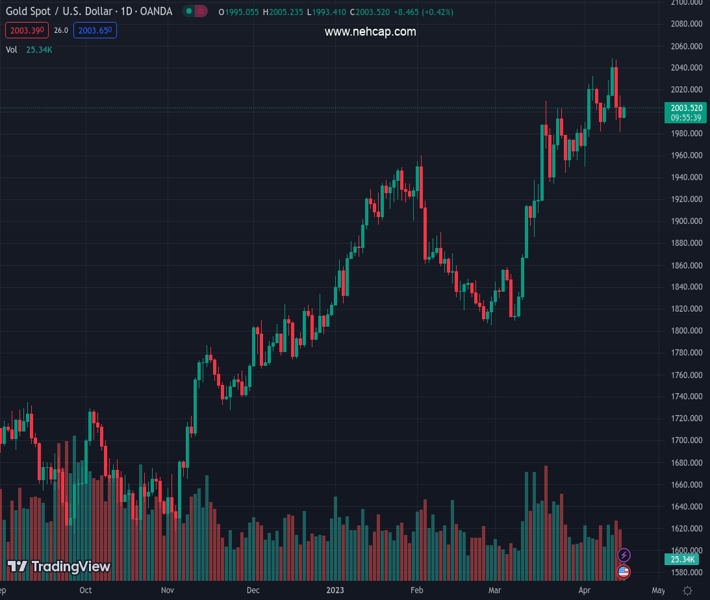
Gold price regains some positive traction on Tuesday and moves away from a one-and-half-week low, around the $1,981 region touched the previous day. The XAU/USD sticks to its modest intraday gains, around the $2,000 psychological mark, through the first half of the European session, though the intraday uptick lacks bullish conviction.
The US Dollar (USD) comes under some selling pressure and for now, seems to have stalled a two-day-old recovery trend from a one-year low touched last week. This, in turn, is seen lending some support to the US Dollar-denominated Gold price, though a combination of factors keeps a lid on any meaningful appreciating move. The Federal Reserve (Fed) is expected to continue lifting interest rates amid a rise in short-term inflation expectations. This, along with a positive tone around the equity markets, might hold back traders from placing aggressive bullish bets around the XAU/USD.
The University of Michigan’s preliminary report released last Friday showed that one-year inflation expectations rose from 3.6% to 4.6% in April. Furthermore, Fed Governor Christopher Waller on Friday called for further rate hikes and said that the job was still not done as inflation remains far too high. Adding to this, the New York Fed reported on Monday that its barometer of manufacturing activity in the state increased for the first time in five months. This, in turn, lifted bets for another 25 basis points (bps) lift-off at the next Federal Open Market Committee (FOMC) meeting in May.
The prospects for further policy tightening by the Fed keep the US Treasury bond yields elevated, which, in turn, caps gains for the non-yielding Gold price. Meanwhile, stronger-than-expected Chinese economic growth eases fears about an imminent global recession and boosts investors’ confidence. Data released earlier this Tuesday showed that the Chinese economy expanded by 4.5% during the January-March quarter, well above estimates and the 2.9% in the previous quarter. This, in turn, dents demand for traditional safe-haven assets and keeps a lid on any further gains for the XAU/USD.
Market participants now look forward to the US economic docket, featuring the release of Building Permits and Housing Starts later during the early North American session. This, along with the US bond yields, will influence the USD price dynamics and provide some impetus to Gold price. Apart from this, traders will take cues from the broader risk sentiment to grab short-term opportunities around the XAU/USD.
From a technical perspective, the $1,980 area now seems to have emerged as an immediate strong support. A convincing break through the said level will negate the positive outlook and prompt some technical selling. The Gold price might then accelerate the corrective decline towards the $1,965-$1,960 intermediate support en route to the $1,950 horizontal zone.
On the flip side, bulls might now wait for a move beyond the overnight swing high, around the $2,015-$2,016 area before placing fresh bets. The Gold price might then climb to the YTD peak, around the $2,047-$2,049 region touched last Thursday, before climbing further towards retesting the all-time high, around the $2,070-$2,075 region set in August 2020.
Technical Levels: Supports and Resistances
XAUUSD currently trading at 2002.83 at the time of writing. Pair opened at 1995.16 and is trading with a change of 0.38 % .
| Overview | Overview.1 | |
|---|---|---|
| 0 | Today last price | 2002.83 |
| 1 | Today Daily Change | 7.67 |
| 2 | Today Daily Change % | 0.38 |
| 3 | Today daily open | 1995.16 |
The pair remains strongly bullish on the daily timeframe. It trades above its 20 SMA @ 1989.4, 50 SMA 1909.64, 100 SMA @ 1877.84 and 200 SMA @ 1794.96.
| Trends | Trends.1 | |
|---|---|---|
| 0 | Daily SMA20 | 1989.40 |
| 1 | Daily SMA50 | 1909.64 |
| 2 | Daily SMA100 | 1877.84 |
| 3 | Daily SMA200 | 1794.96 |
The previous day high was 2015.13 while the previous day low was 1981.23. The daily 38.2% Fib levels comes at 1994.18, expected to provide support. Similarly, the daily 61.8% fib level is at 2002.18, expected to provide support.
Note the levels of interest below:
- Pivot support is noted at 1979.22, 1963.27, 1945.32
- Pivot resistance is noted at 2013.12, 2031.07, 2047.02
| Levels | Levels.1 |
|---|---|
| Previous Daily High | 2015.13 |
| Previous Daily Low | 1981.23 |
| Previous Weekly High | 2048.75 |
| Previous Weekly Low | 1986.28 |
| Previous Monthly High | 2009.88 |
| Previous Monthly Low | 1809.46 |
| Daily Fibonacci 38.2% | 1994.18 |
| Daily Fibonacci 61.8% | 2002.18 |
| Daily Pivot Point S1 | 1979.22 |
| Daily Pivot Point S2 | 1963.27 |
| Daily Pivot Point S3 | 1945.32 |
| Daily Pivot Point R1 | 2013.12 |
| Daily Pivot Point R2 | 2031.07 |
| Daily Pivot Point R3 | 2047.02 |
[/s2If]
Join Our Telegram Group
")


