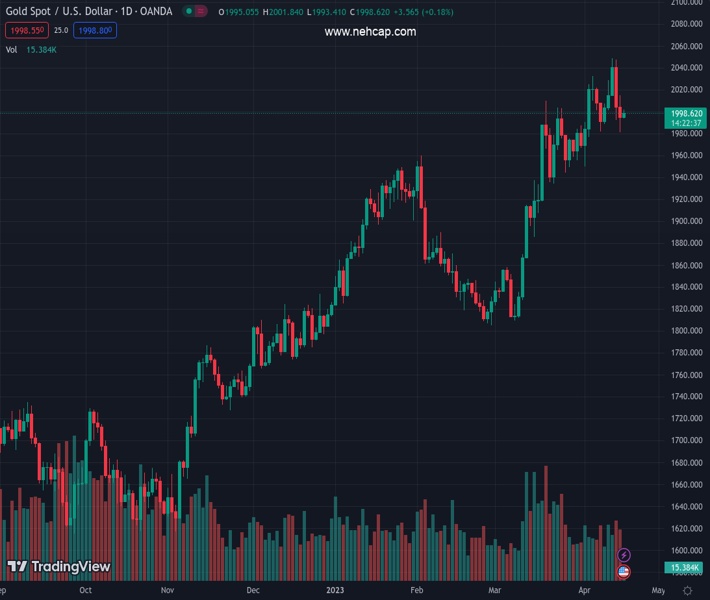
#XAUUSD @ 1,998.27 Gold price stays defensive after declining in the last two consecutive days., @nehcap view: Further downside expected (Pivot Orderbook analysis)
…
This is a premium post.
[s2If !current_user_can(access_s2member_level4)]Please register for PREMIUM VERSION HERE to read full post below containing analysis. In case of any error or you think you are not able to read the full post below, please email us at support#nehcap.com [lwa][/s2If] [s2If current_user_can(access_s2member_level4)]
- Gold price stays defensive after declining in the last two consecutive days.
- Upbeat United States data, hawkish Federal Reserve bets challenge recent pullback in Treasury bond yields and US Dollar.
- Firmer China GDP allows XAU/USD to grind higher, anxiety ahead of US debt ceiling talks prod Gold buyers.
- Second-tier US data, Fed talks eyed for intermediate XAU/USD directions ahead of Friday’s Purchasing Managers Indexes.
The pair currently trades last at 1998.27.
The previous day high was 2015.13 while the previous day low was 1981.23. The daily 38.2% Fib levels comes at 1994.18, expected to provide support. Similarly, the daily 61.8% fib level is at 2002.18, expected to provide resistance.
Gold price (XAU/USD) struggles to defend early Tuesday’s corrective bounce around the $2,000 round figure as XAU/USD bears the burden of the US Dollar’s retreat heading into the European session. That said, the market’s mixed sentiment joins the cautious mood ahead of top-tier United States events and data to prod the Gold buyers, even if the recent China statistics have been impressive.
Despite the latest struggle of the XAU/USD bulls, Gold price manages to push back the bearish bias that dominated in the last two days amid a retreat of the United States Treasury bond yields and the US Dollar. That said, the US Dollar Index (DXY) eases to 102.00 as the 10-year and two-year Treasury bond yields snap a three-day uptrend with mild losses around 3.60% and 4.18% respectively by the press time.
Despite the latest retreat of the US Dollar and Treasury bond yields, the upbeat United States statistics join hawkish Federal Reserve (Fed) bets to put a floor under the USD, which in turn challenges the Gold buyers.
On Monday, the NY Empire State Manufacturing Index jumped to 10.8 for April while snapping the four-month downtrend, as well as marking the highest level since July last year. Further, the US National Association of Home Builders (NAHB) housing market index also rose for the fourth consecutive month in April to 45, versus 44 expected and prior reading. Following the data, Richmond Fed President Thomas Barkin said on Monday that he wants to see more evidence of inflation settling back to target. The policymaker also added that he feels reassured by what he is seeing in the banking sector.
It’s worth noting that Friday’s US consumer-centric data triggered the XAU/USD pullback from a multi-day high.
The latest cautious mood ahead of the US debt ceiling plan, up for publishing on Wednesday, challenges the US Dollar bulls, while also luring the Gold buyers, as the policymakers appear divided about the details before the June deadline.
Earlier in the day, “Stephen Joseph Scalise who serves as the House Majority Leader and representative for Louisiana’s 1st congressional district has stated that the Grand Old Party, (GOP) debt ceiling plan is coming tomorrow,” per Reuters.
Over the weekend, President Christine Lagarde said that she has “huge confidence” the US will not allow the country to default on its debt.
Elsewhere, upbeat economics from China, one of the biggest Gold consumers, also favor the XAU/USD bulls. That said, China’s Q1 GDP grows 2.2% QoQ versus 2.2% expected and 0.0% prior. Further, Retail Sales growth jumps 10.9% YoY in March versus 7.4% expected and 3.5% prior whereas Industrial Production eased below 4.0% expected growth figures to 3.9%, versus 2.4% previous readings.
Having witnessed Gold’s initial reaction to China’s first quarter Gross Domestic Product (GDP), the XAU/USD traders should wait for the US Housing Starts and Building Permits for March to aptly predict intraday moves of the metal. However, major attention will be given to the talks surrounding the US debt ceiling and Federal Reserve (Fed) as recent hawkish bias about the US central bank allowed the US Dollar to rebound and weigh on the Gold price.
Also read: Gold Price Forecast: XAU/USD bulls fight for control amid a potential bearish wedge
Gold price picks up bids inside a one-month-old bullish trend channel, suggesting overall upside momentum. However, the latest break of the 10-DMA support, as well as the latest bearish Moving Average Convergence and Divergence (MACD) signals, keep XAU/USD sellers hopeful.
That said, the stated channel’s bottom line, around $1,964, precedes the February 2023 peak surrounding $1,960, to restrict the short-term Gold price downside of the metal.
Meanwhile, XAU/USD recovery needs validation from the 10-DMA support-turned-resistance, close to $2,010 at the latest.
Following that, the stated channel’s top line, near $2,045, can act as the last defense of the Gold price before directing XAU/USD towards the previous yearly top surrounding $2,070. Above all, the all-time high of around $2,075, marked in 2020, acts as the last defense of the Gold sellers.
To sum up, Gold remains firmer within a bullish chart formation, despite the pullback in the XAU/USD price.
Trend: Further downside expected
Technical Levels: Supports and Resistances
XAUUSD currently trading at 1999.34 at the time of writing. Pair opened at 1995.16 and is trading with a change of 0.21% % .
| Overview | Overview.1 | |
|---|---|---|
| 0 | Today last price | 1999.34 |
| 1 | Today Daily Change | 4.18 |
| 2 | Today Daily Change % | 0.21% |
| 3 | Today daily open | 1995.16 |
The pair remains strongly bullish on the daily timeframe. It trades above its 20 SMA @ 1989.4, 50 SMA 1909.64, 100 SMA @ 1877.84 and 200 SMA @ 1794.96.
| Trends | Trends.1 | |
|---|---|---|
| 0 | Daily SMA20 | 1989.40 |
| 1 | Daily SMA50 | 1909.64 |
| 2 | Daily SMA100 | 1877.84 |
| 3 | Daily SMA200 | 1794.96 |
The previous day high was 2015.13 while the previous day low was 1981.23. The daily 38.2% Fib levels comes at 1994.18, expected to provide support. Similarly, the daily 61.8% fib level is at 2002.18, expected to provide resistance.
Note the levels of interest below:
- Pivot support is noted at 1979.22, 1963.27, 1945.32
- Pivot resistance is noted at 2013.12, 2031.07, 2047.02
| Levels | Levels.1 |
|---|---|
| Previous Daily High | 2015.13 |
| Previous Daily Low | 1981.23 |
| Previous Weekly High | 2048.75 |
| Previous Weekly Low | 1986.28 |
| Previous Monthly High | 2009.88 |
| Previous Monthly Low | 1809.46 |
| Daily Fibonacci 38.2% | 1994.18 |
| Daily Fibonacci 61.8% | 2002.18 |
| Daily Pivot Point S1 | 1979.22 |
| Daily Pivot Point S2 | 1963.27 |
| Daily Pivot Point S3 | 1945.32 |
| Daily Pivot Point R1 | 2013.12 |
| Daily Pivot Point R2 | 2031.07 |
| Daily Pivot Point R3 | 2047.02 |
[/s2If]
Join Our Telegram Group
")


