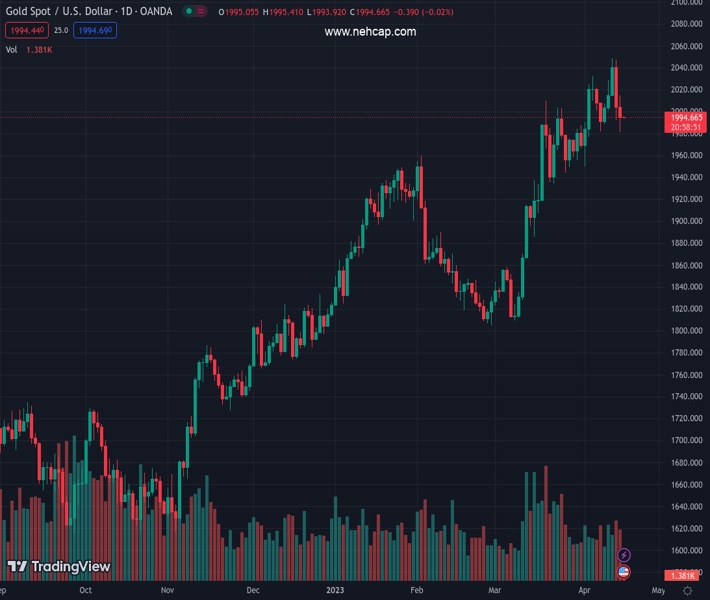
#XAUUSD @ 1,994.13 Gold price has attempted a recovery and has scaled to near $1,994.60 amid a mild correction in the USD Index. (Pivot Orderbook analysis)
…
This is a premium post.
[s2If !current_user_can(access_s2member_level4)]Please register for PREMIUM VERSION HERE to read full post below containing analysis. In case of any error or you think you are not able to read the full post below, please email us at support#nehcap.com [lwa][/s2If] [s2If current_user_can(access_s2member_level4)]
- Gold price has attempted a recovery and has scaled to near $1,994.60 amid a mild correction in the USD Index.
- It would not be justified considering Gold’s recovery move as a reversal as bets for one more rate hike from the Fed is extremely solid.
- Fed’s Beige Book will provide cues about the current economic situation of 12 Fed districts.
The pair currently trades last at 1994.13.
The previous day high was 2047.49 while the previous day low was 1992.45. The daily 38.2% Fib levels comes at 2013.48, expected to provide resistance. Similarly, the daily 61.8% fib level is at 2026.46, expected to provide resistance.
Gold price (XAU/USD) has shown a recovery move after printing an eight-day low of $1,981.02 on late Monday. The precious metal has rebounded to near $1,996.00 after a mild correction in the US Dollar Index (DXY). It would not be justified considering the recovery move as a reversal as bets for one more rate hike from the Federal Reserve (Fed) are extremely solid.
S&P500 futures are choppy in early trade after a bullish Monday. US equities are ignoring China-Taiwan tensions, portraying a risk-on mood. Reports showed that Taiwan will purchase up to 400 land-launched harpoon missiles to repel a potential Chinese invasion, completing a deal approved by Congress in 2020.
The US Dollar Index (DXY) is juggling above 102.00 after a mild correction. The upside bias has not faded yet as Federal Reserve (Fed) policymakers are not convinced of easing inflationary pressures. and CEO of the Federal Reserve Bank of Richmond Thomas Barkin said in the late New York session that he wants to see more evidence of inflation settling back to target.
This week, the release of Fed’s Beige Book will be keenly observed. The report will provide cues about the current economic situation of 12 Fed districts. Also, it will provide a true picture of retail demand and employment levels on a regional basis.
Gold price is hovering near the lower portion of the Rising Channel chart pattern formed on a two-hour scale. The precious metal dropped sharply after failing to test the critical resistance of $2,050.00 but has found an intermediate cushion near the Rising Channel edge. The 20-period Exponential Moving Average (EMA) at $2,005.60 is acting as a barricade for the Gold bulls.
The Relative Strength Index (RSI) (14) has shifted into the bearish range of 20.00-40.00, indicating activation of bearish momentum.
Technical Levels: Supports and Resistances
XAUUSD currently trading at 1994.33 at the time of writing. Pair opened at 2004.2 and is trading with a change of -0.49 % .
| Overview | Overview.1 | |
|---|---|---|
| 0 | Today last price | 1994.33 |
| 1 | Today Daily Change | -9.87 |
| 2 | Today Daily Change % | -0.49 |
| 3 | Today daily open | 2004.20 |
The pair remains strongly bullish on the daily timeframe. It trades above its 20 SMA @ 1989.11, 50 SMA 1907.04, 100 SMA @ 1875.45 and 200 SMA @ 1793.7.
| Trends | Trends.1 | |
|---|---|---|
| 0 | Daily SMA20 | 1989.11 |
| 1 | Daily SMA50 | 1907.04 |
| 2 | Daily SMA100 | 1875.45 |
| 3 | Daily SMA200 | 1793.70 |
The previous day high was 2047.49 while the previous day low was 1992.45. The daily 38.2% Fib levels comes at 2013.48, expected to provide resistance. Similarly, the daily 61.8% fib level is at 2026.46, expected to provide resistance.
Note the levels of interest below:
- Pivot support is noted at 1981.94, 1959.67, 1926.9
- Pivot resistance is noted at 2036.98, 2069.75, 2092.02
| Levels | Levels.1 |
|---|---|
| Previous Daily High | 2047.49 |
| Previous Daily Low | 1992.45 |
| Previous Weekly High | 2048.75 |
| Previous Weekly Low | 1986.28 |
| Previous Monthly High | 2009.88 |
| Previous Monthly Low | 1809.46 |
| Daily Fibonacci 38.2% | 2013.48 |
| Daily Fibonacci 61.8% | 2026.46 |
| Daily Pivot Point S1 | 1981.94 |
| Daily Pivot Point S2 | 1959.67 |
| Daily Pivot Point S3 | 1926.90 |
| Daily Pivot Point R1 | 2036.98 |
| Daily Pivot Point R2 | 2069.75 |
| Daily Pivot Point R3 | 2092.02 |
[/s2If]
Join Our Telegram Group
")


